
Currently, Bitcoin is valued at $115,934 and boasts a market cap of $2.30 trillion. In the last 24 hours, it experienced a trading volume of $27.62 billion and fluctuated between an intraday low of $115,157 and a high of $116,541.
Bitcoin Overview
The daily chart indicates that Bitcoin has recently bounced back from a low around $107,270 to surpass the $117,000 mark, demonstrating robust recovery. However, this upward trend seems to be losing steam as evidenced by shorter green candlesticks which may indicate diminishing buying pressure.
Key resistance levels are identified between $118,000 and $119,000 while support is found near the vicinity of $112,000. A retracement towards the range of $112,000–$113,000 accompanied by increased trading volume could present an attractive long entry point with potential exits near upper resistance levels.
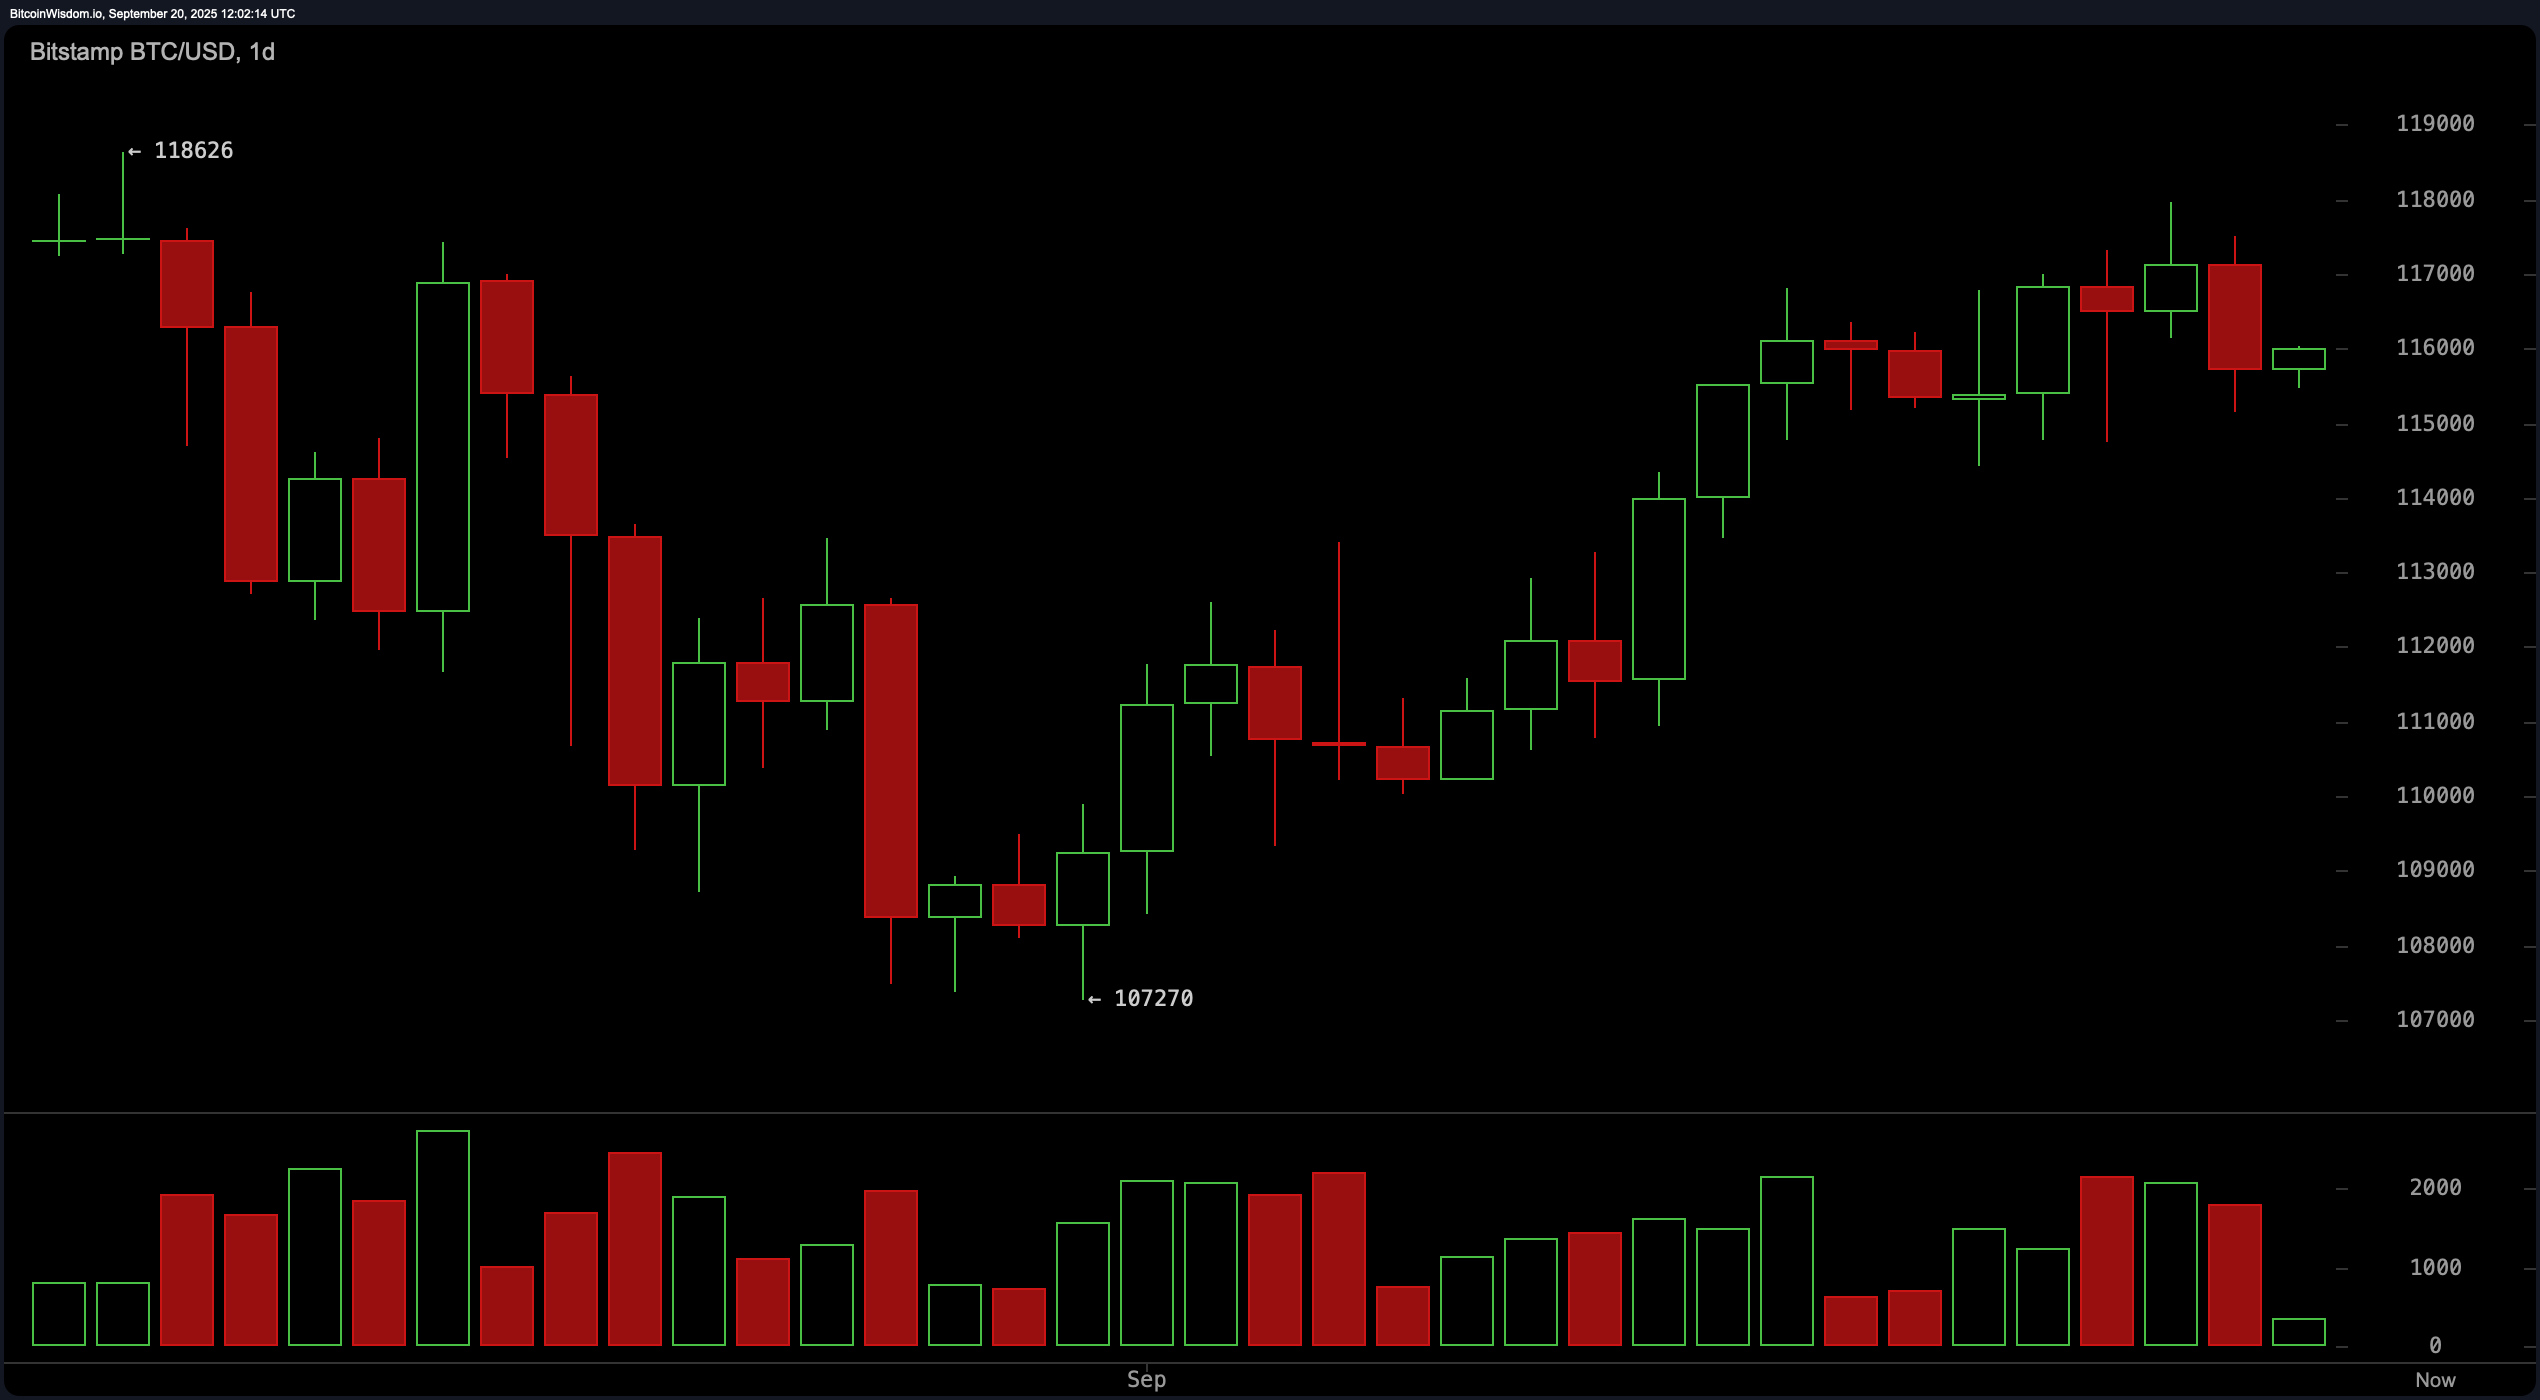
BTC/USD 1-day chart via Bitstamp on Sept. 20th.
The four-hour chart for Bitcoin reveals signs indicating a short-term downtrend characterized by lower highs since September 18th. After reaching a local peak at approximately $117,968 followed by a drop to around $114,421 before stabilizing again; current price movements suggest consolidation with bearish tendencies prevailing. A sustained breakout above the level of $$117k coupled with high volume could signal bullish continuation; conversely another rejection here might push prices down toward the support level at about $$114k.
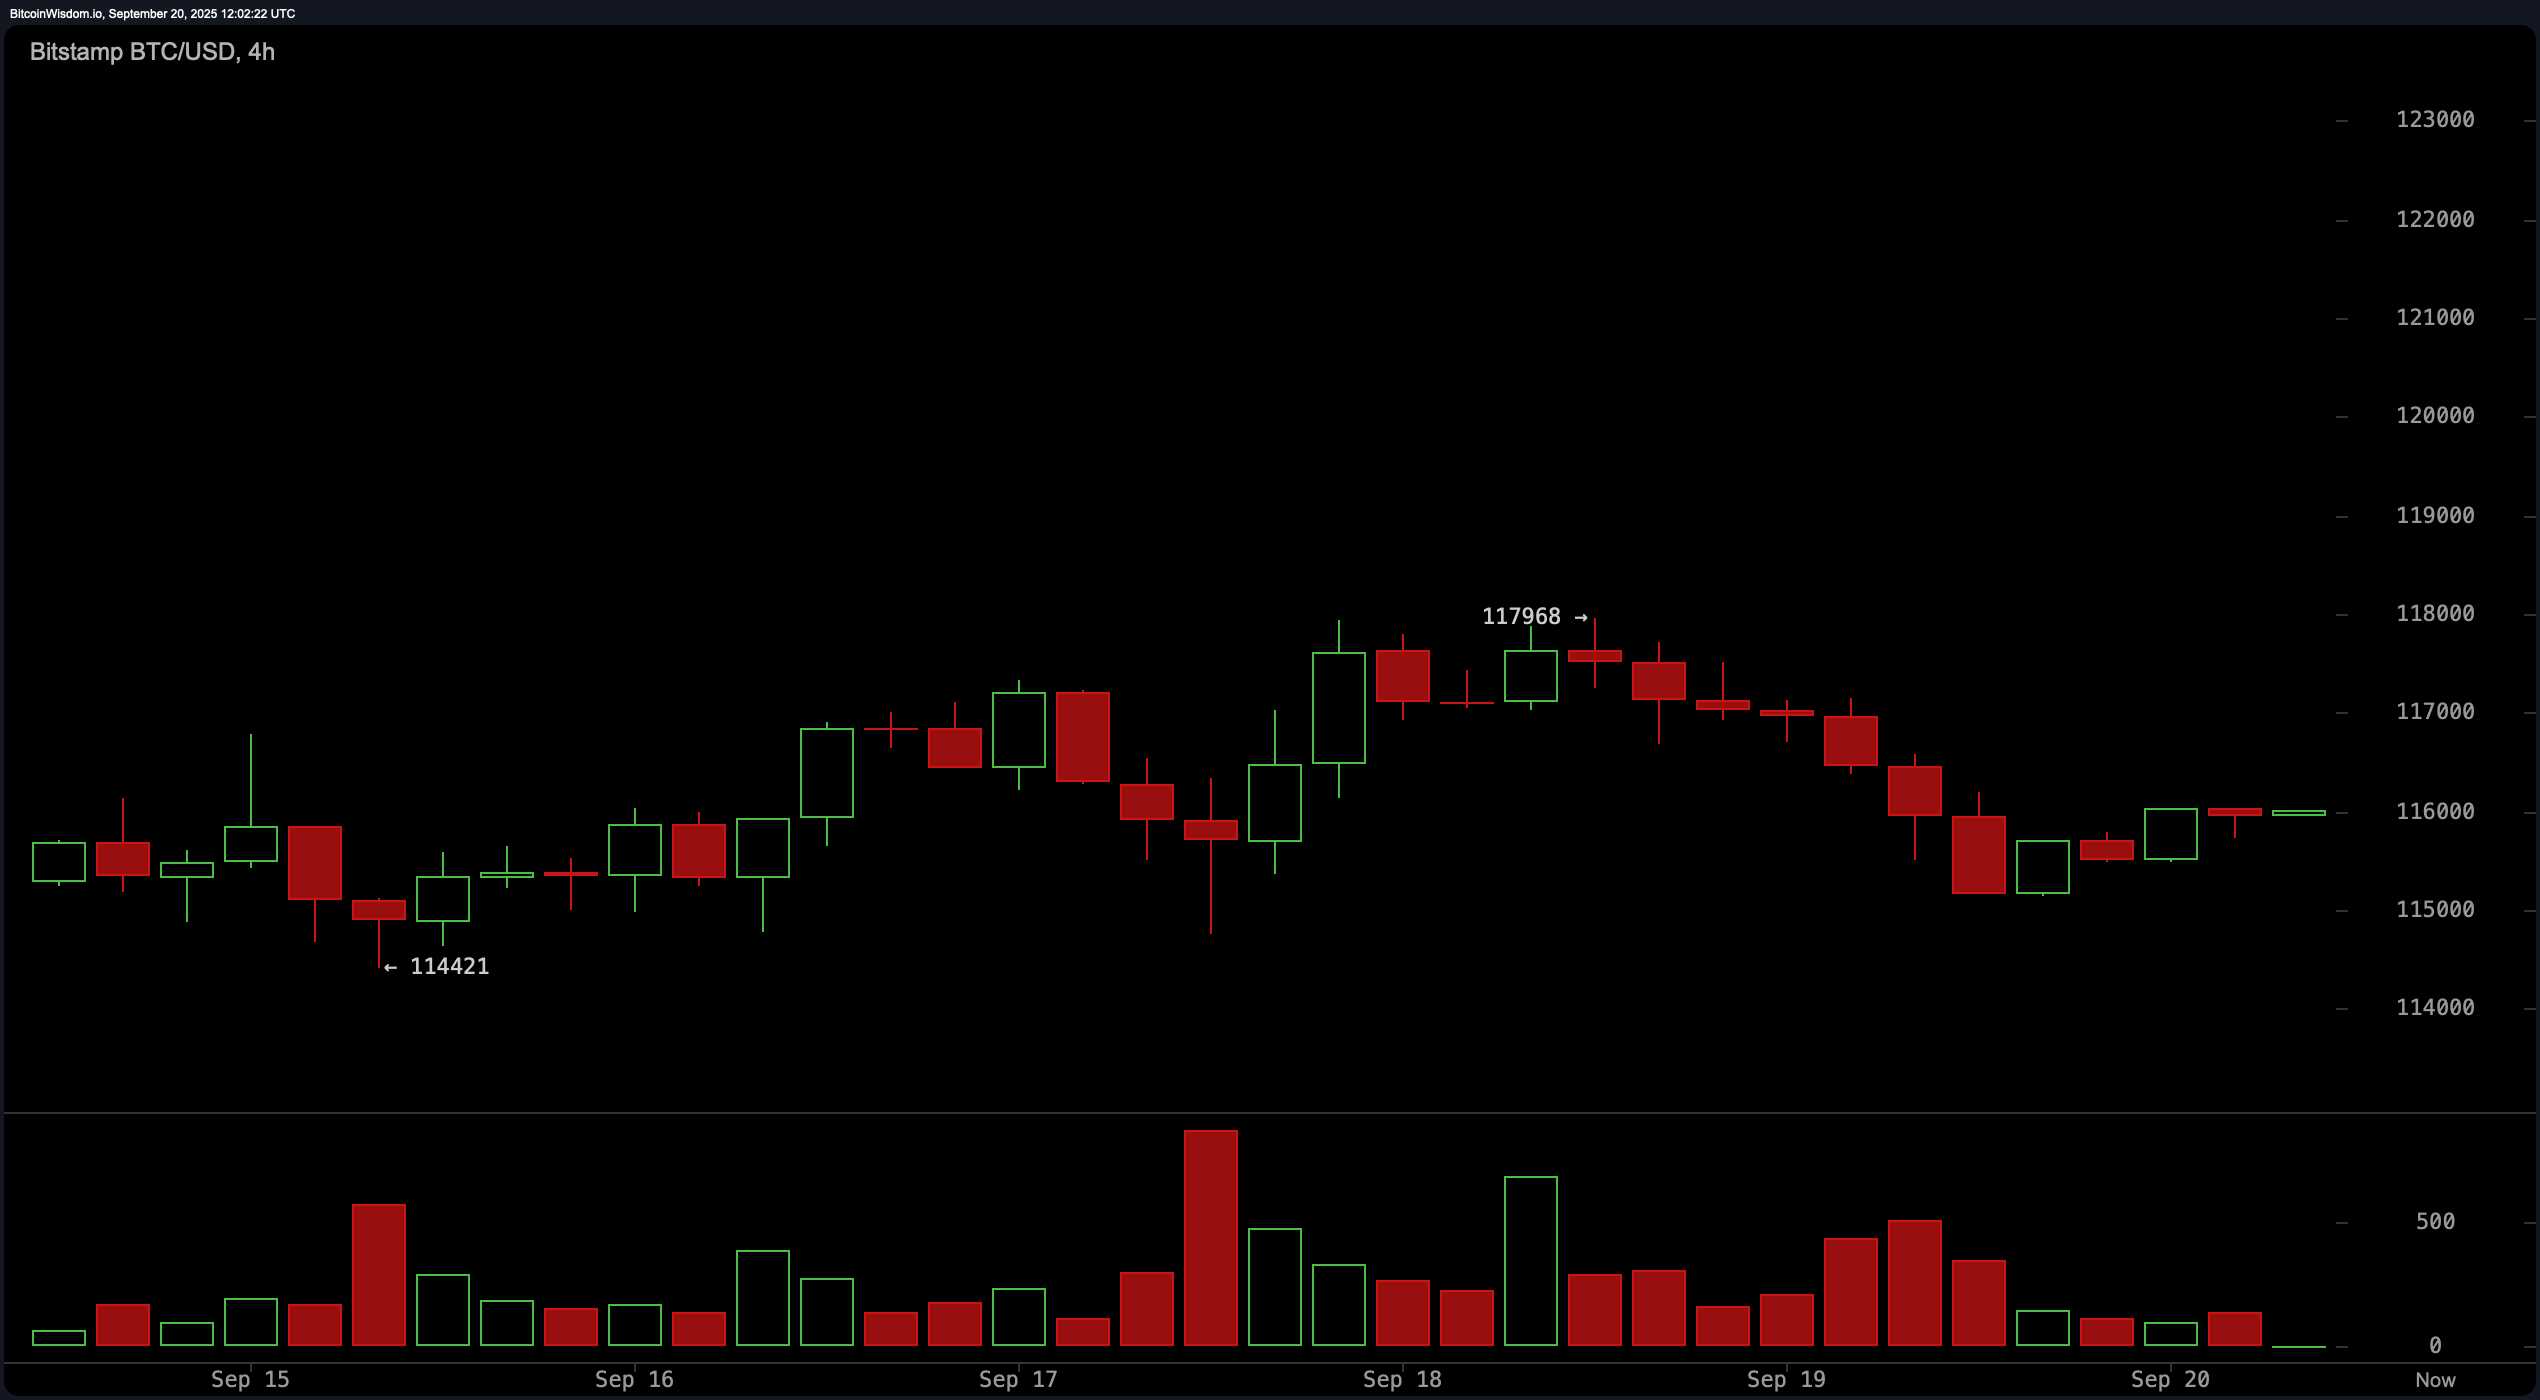
BTC/USD 4-hour chart via Bitstamp on Sept. 20th.
The one-hour Bitcoin chart shows that there was recently a drop to approximately $$115k followed by sideways movement indicating indecision in market sentiment without significant buying activity being evident through volume metrics thus far . Should prices rise past $$116200 , cautious traders might consider entering short-term long positions ; however , another rejection within ranges from about $$116500 -$$16800 could trigger pullbacks back towards levels closer to or below $$115k .
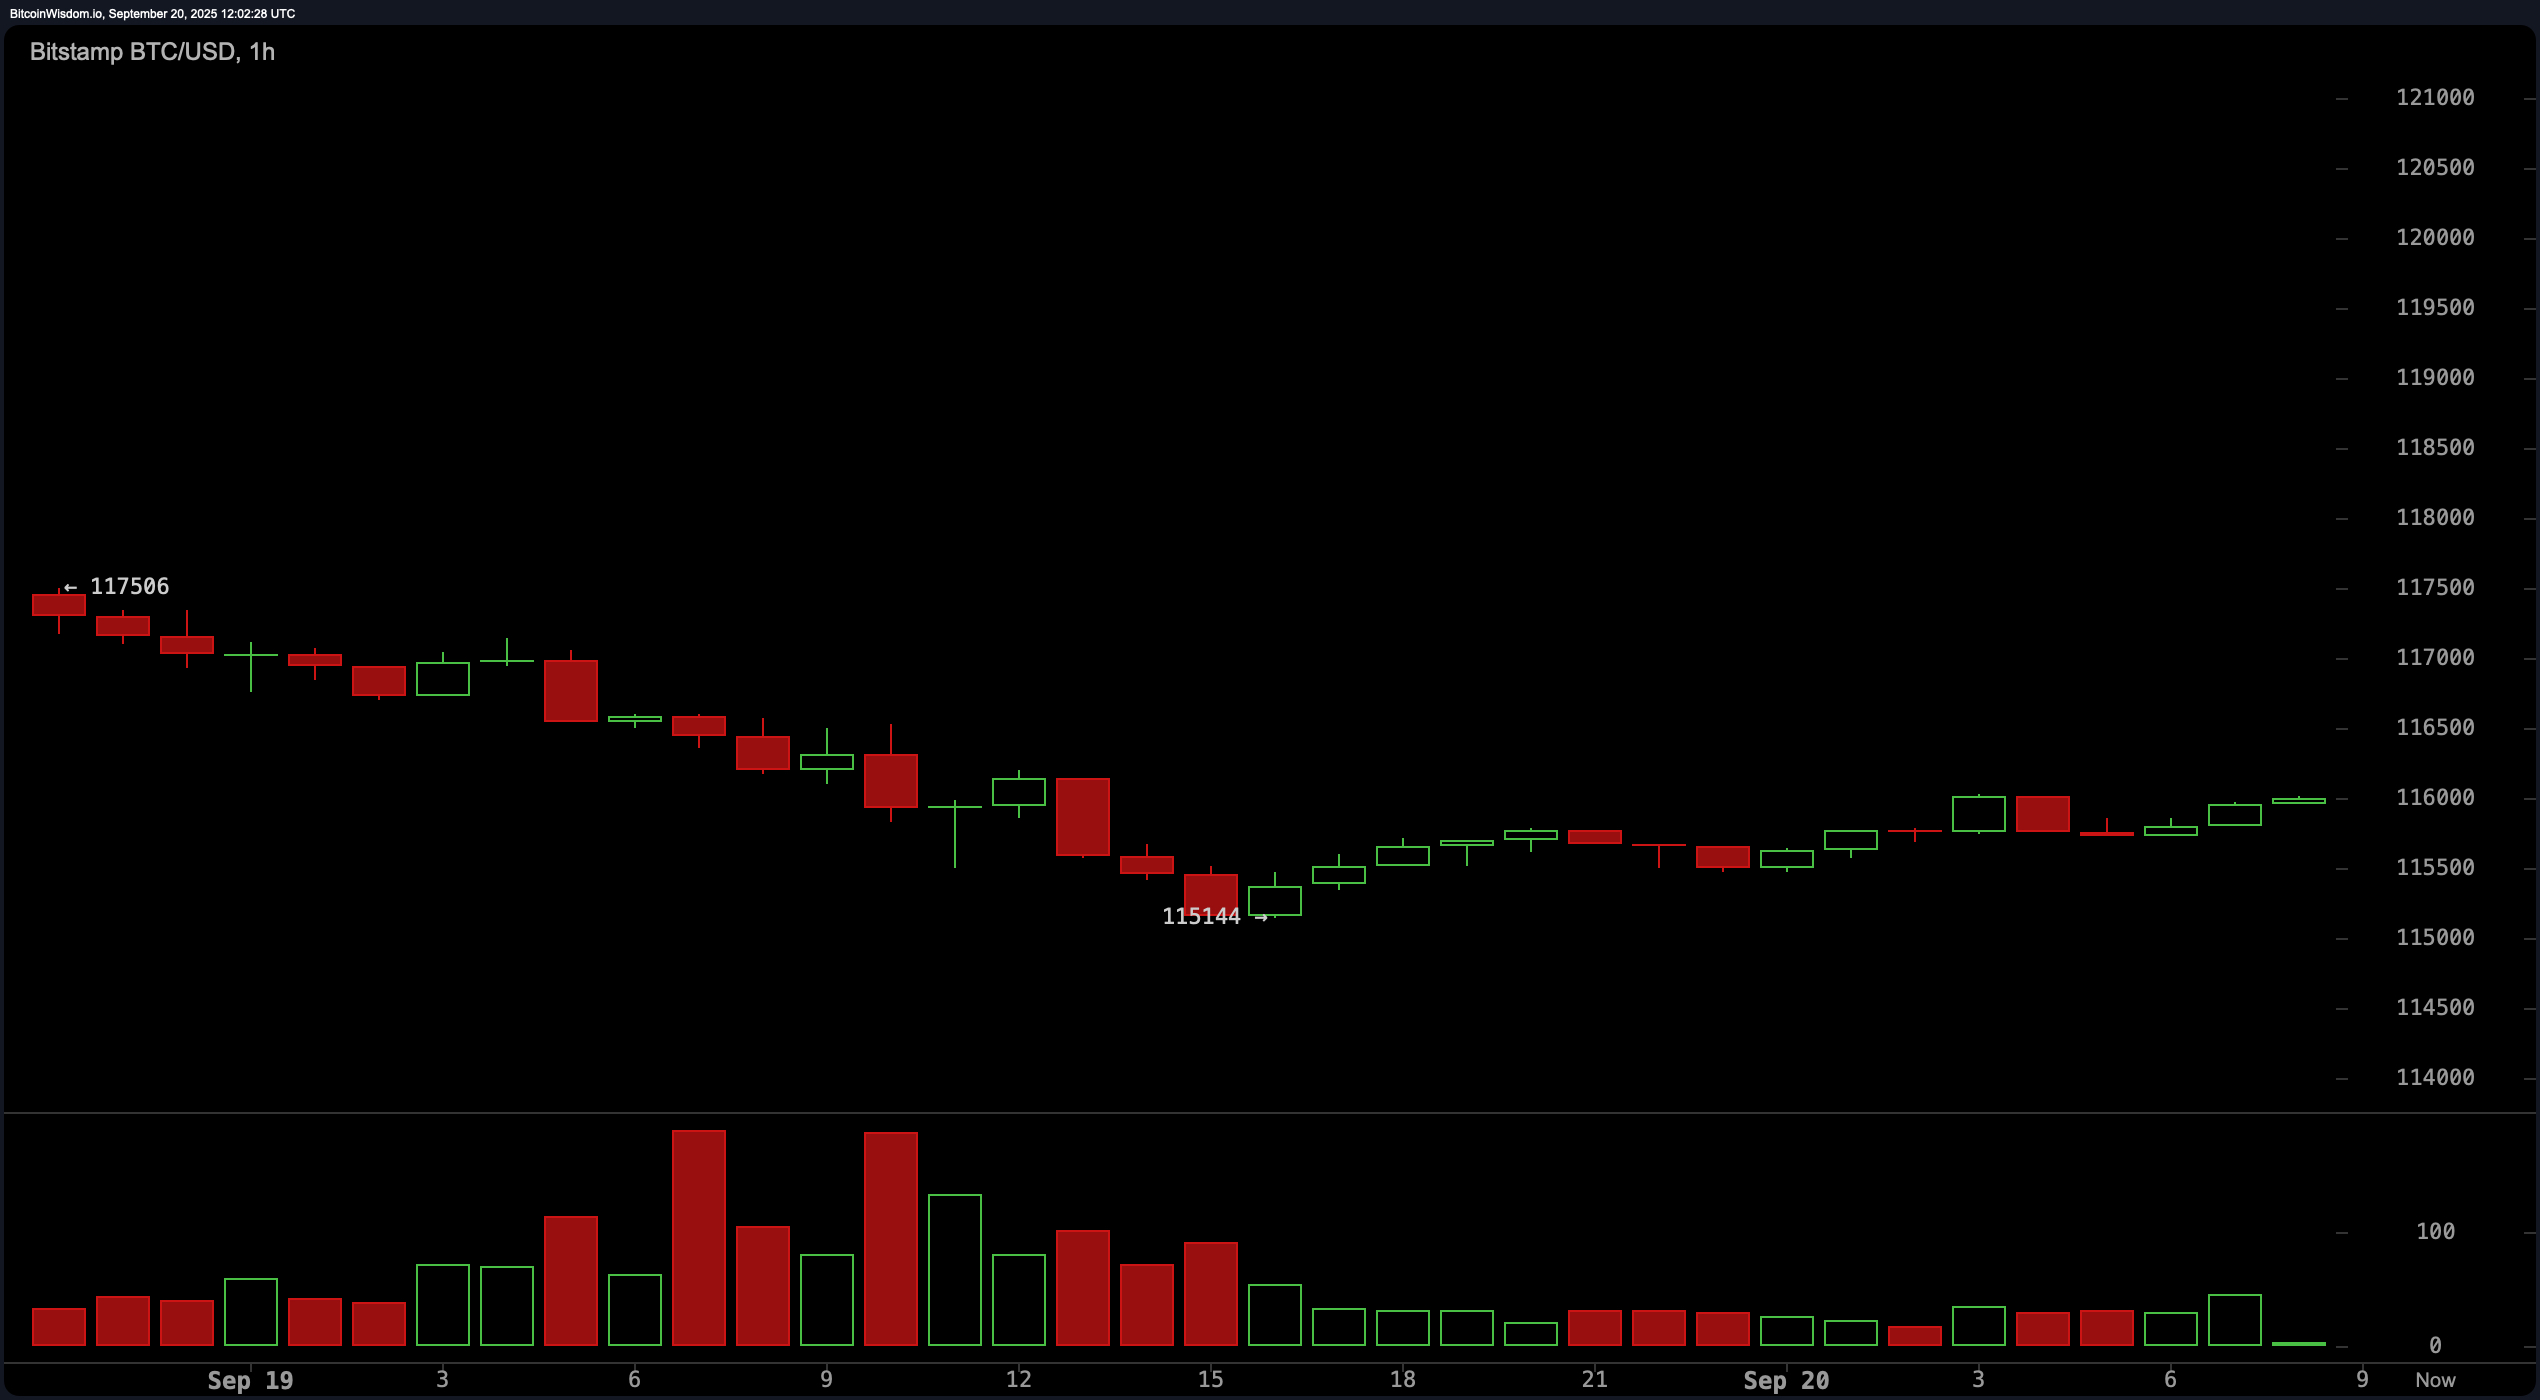
BTC/USD 1-hour chart via Bitstamp on Sept.20th.
Oscillators currently display mostly neutral signals: The relative strength index (RSI) stands at fifty-six while Stochastic reads seventy-eight; commodity channel index (CCI) measures sixty-four alongside average directional index (ADX) reading eighteen along with Awesome oscillator (AO) measuring three thousand one hundred seventy-six—all suggesting neutrality overall . Although momentum oscillators indicate bearish trends presently moving average convergence divergence(MACD ) appears bullish today .
Moving averages show an overarching positive sentiment across different timeframes where all exponential moving averages(EMAs ) ranging from ten up until two hundred periods remain firmly within bullish territory whereas most simple moving averages(SMAs ) also reflect similar inclinations except for ten-period SMA which indicates bearishness currently instead
.
In conclusion , bitcoin holds onto its neutral-to-slightly-bullish technical outlook whereby long positions can be contemplated close around support zones situated between one hundred twelve thousand- one hundred thirteen thousand yet caution must prevail when approaching resistance clusters located nearby seventeen-thousand five-hundred-seventeen-thousand eight-hundred areas.Traders should await stronger confirmations through volumes prior committing significantly into trades ahead
Bullish Perspective:
With consistent higher lows established alongside solid backing found near twelve-thousand dollars plus majority indicators signaling buys throughout various timelines—bitcoin retains structurally optimistic posture going forward if volumes surge allowing breakouts beyond seventeen-thousands dollars likely paving way towards eighteen thousands-nineteen thousands resistance zones reinforcing case further upside momentum anticipated going forward.
Bearish Perspective:
Despite recent recoveries occurring weakness persists regarding momentum leading up rejections occurring consistently beneath threshold values nearing seventeen-thousands suggesting current rallies lack conviction.Short term downward pressures indicated through lower timeframe readings combined neutrality reflected across oscillators imply possible downside risks especially if prices fail holding above fourteen-fifty opening pathways deeper corrections targeting zones surrounding twelve grand dollar marks instead.