
On April 5, 2026, Bitcoin was priced at $66,992, boasting a market cap of $1.34 trillion and a trading volume of $19.69 billion over the last 24 hours. The cryptocurrency’s price fluctuated within a tight range from $66,633 to $67,469 during the day, indicating ongoing consolidation without any decisive directional movement.
Key Insights:
Bitcoin remained around the price of $66,992 on April 5, 2026; weak momentum indicators limit potential gains.
The cryptocurrency trades below its 10- and 200-day moving averages (MAs); this bearish framework weighs on overall crypto sentiment.
The trading range between $65.5K and $69.5K persists; an imminent breakout or breakdown seems likely as the next step.
Bitcoin Chart Analysis
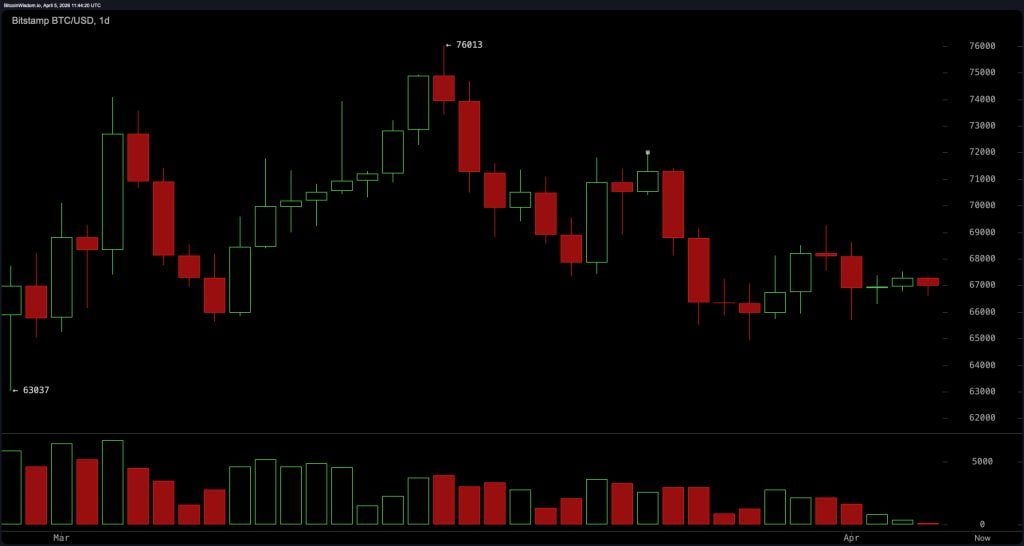
The daily chart shows that Bitcoin is still trapped in a broad sideways pattern while staying above support levels near $66,500 but struggling to breach resistance around the mid-$74K mark. The creation of lower highs in the mid-$70s adds to a slight bearish bias without indicating an outright trend reversal just yet. Prices remain confined to the lower half of this range suggesting that sellers maintain control structurally even if momentum has not decisively followed through yet.
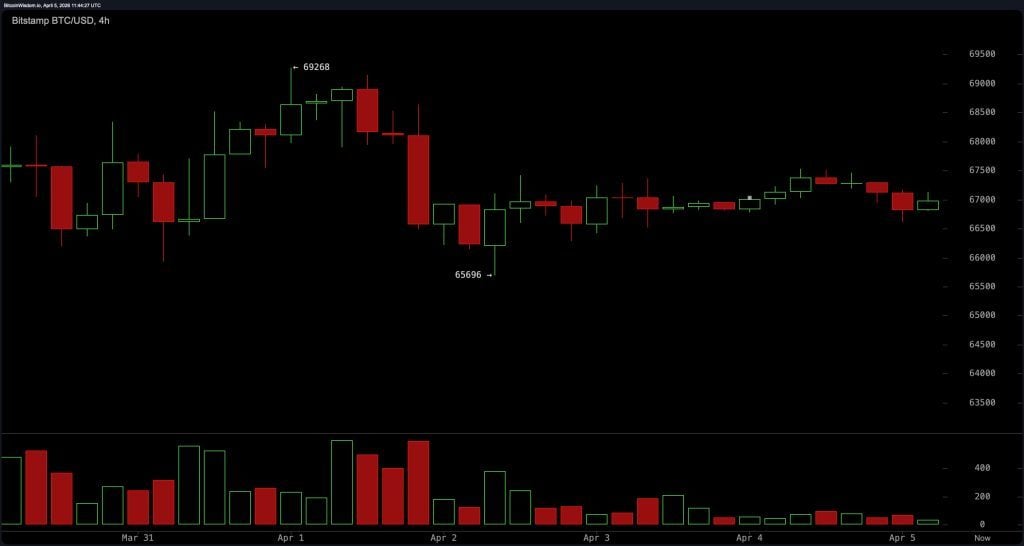
The four-hour chart for Bitcoin illustrates a classic range-bound scenario where prices fluctuate between approximately $65,500 and $69,500. Frequent rejections near the upper boundary coupled with consistent responses at lower levels indicate that liquidity rather than directionality drives market behavior right now. Volatility remains low with price movements lacking significant expansion keeping Bitcoin in limbo where neither buyers nor sellers seem particularly driven.
<pExamining the one-hour chart reveals further tightening into an even narrower band ranging from about $66,978 to $67,.021.A series of slightly declining highs introduces mild short-term bearish pressure although these moves lack strength or follow-through.This type compression often precedes expansion but currently,Bitcoin remains caught in low-energy equilibrium offering little clarity beyond short-term positioning at extremes within its current range.
$ BTC / USD one – hour chart via Bitstamp on April five , two thousand twenty-six .
Oscillators continue reflecting largely neutral-to-weak momentum profiles.The relative strength index (RSI) stands at forty-four suggesting subdued momentum without oversold conditions.The Stochastic indicator reads thirty while commodity channel index (CCI) registers negative sixty-seven both reinforcing neutral positioning.Furthermore,the average directional index(ADX) reading fifteen confirms absence meaningful trends.
Awesome oscillator(AO) prints negative two thousand seventy-six while moving average convergence divergence(MACD) level sits at negative eight hundred fifty-two signaling bearish momentum.Momentum(ten) shows up as negative one thousand eight hundred five registering counterintuitive positive signals highlighting lack cohesion across various indicators.
Moving averages(MAs)presents far less ambiguous picture which isn’t particularly supportive.Exponential moving average(EMA)(ten)is located seventy-one dollars above current prices indicating downward pressure short term.
Bullish Outlook:
Although remaining bound within ranges,Bitcoin stays structurally intact above crucial support close sixty-six thousand five hundred compressed actions hinting possible volatility expansions ahead.Sustained movements toward upper boundaries nearing sixty-nine thousand five hundred seventy-four would challenge existing bear biases especially if accompanying indicators align—a significant “if” but not outlandish possibility.
Bearish Outlook:
Overall technical structures lean negatively with Bitcoins positioned beneath all major MAs failing reclaim higher resistance zones.Persistent weaknesses across multiple metrics combined lowered highs suggest downside risks persist unless pricing can regain elevated territories—and presently it doesn’t appear eager do so.P>