On April 4, 2026, at 8 a.m. Eastern Time, Bitcoin was priced at $67,109. The cryptocurrency’s market capitalization stood at $1.32 trillion with a trading volume of $45.26 billion over the past 24 hours. During this session, Bitcoin’s price fluctuated between $65,934 and $69,074, indicating ongoing volatility within a larger consolidation phase.
Key Insights:
- Bitcoin maintained its position around the $67K mark on April 4; range-bound trading suggests weak momentum ahead.
- Market indicators reveal an RSI of 42 and MACD of -894; upward pressure is capped near the $69K level.
- The day recorded a trading volume of approximately $45.2 billion; attention now turns to testing support around the $65,900 mark.
Bitcoin Price Analysis
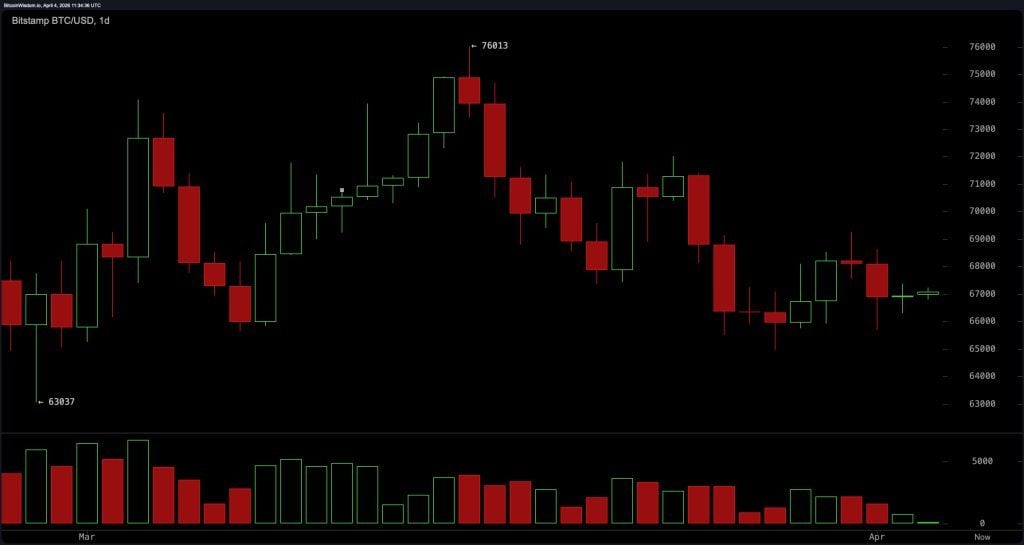
The daily chart for Bitcoin continues to show that the market lacks strong conviction as $BTC remains below critical resistance levels near $69K and significantly under major trend-defining thresholds. The overall structure indicates consolidation within an extended downtrend characterized by lower highs and repeated rejections close to recent upper boundaries.
Although prices have stayed above the crucial area around $65,900 in recent sessions, there is no sustained bullish follow-through evident which implies limited upward momentum and indecisiveness in market sentiment.
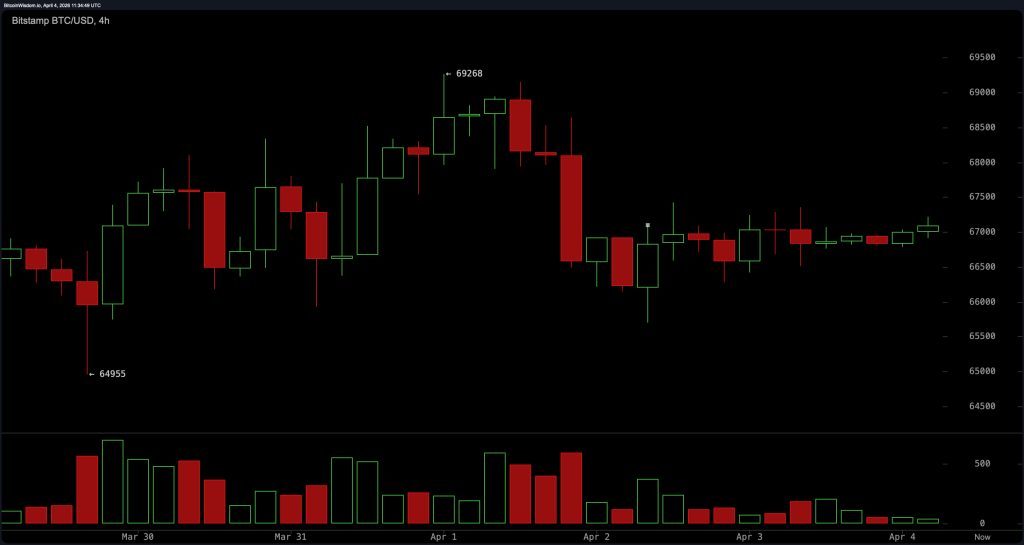
The four-hour chart reveals signs of a potential short-term recovery after dipping to approximately $65,934.19; however, this rebound appears weak as prices move within a descending channel where lower highs are limiting advances and preventing any significant breakout from occurring. This pattern suggests stabilization rather than reversal in market dynamics as attempts for upward movement repeatedly falter before reaching resistance zones between $68K–$69K—indicating that while there may be some bounce back happening currently it lacks strong conviction behind it.
A closer look at the one-hour chart shows elevated volatility but price action has settled into tight consolidation around $66K levels . Minor bullish candles are forming off session lows suggesting some intraday demand exists ; however , these movements lack both momentum & volume confirmation indicating this micro-structure represents more relief bounces instead of actual trend shifts . Prices seem coiled tightly waiting for clearer directional catalysts from participants involved in trades here moving forward

The oscillator readings further confirm indecision prevailing across markets right now: Relative Strength Index (RSI) stands at forty-two while Stochastic sits thirty-two along with Commodity Channel Index (CCI) measuring negative ninety-one—all pointing towards neutral conditions rather than extremes being reached anywhere soon! Average Directional Index (ADX) reads fifteen confirming weakness present throughout trends observed lately too alongside Awesome Oscillator printing negative two thousand one hundred seventy-nine also reflecting neutrality overall here too!
However Momentum(10 ) registered negative four thousand seven hundred thirty-two whereas Moving Average Convergence Divergence(MACD)(12 ,26 ) shows value sitting minus eight hundred ninety-four both hinting underlying pressures still lean toward downside despite broader neutral oscillator summaries existing presently !
Moving Averages(MAs ) paint even more cautious pictures uniformly across charts analyzed thus far: Exponential Moving Average(EMA)(10 ) measured sixty-seven thousand seven hundred fifty-four whilst Simple Moving Average(SMA)(10 ) comes out slightly higher showing sixty-seven thousand eight hundred forty-three signaling downward pressures persistently weighing down upon current pricing structures observed here today!
This bearish alignment extends throughout entire curves tracked so far: EMA(20) measures sixty-eight thousand five hundred thirty-four & SMA(20) hits sixty-nine-thousand five-hundred thirty-one respectively ; EMA(30)=sixty-nine-thousand ninety-four/SMA=sixty-nine-thousand five-hundred twenty-two likewise ;EMA(fifty)=seventy-thousand seven-hundred sixty-two/SMA(same period)=sixty-eight thousands six-fifty only adding further weight onto bearish outlooks seen developing amongst traders operating under these conditions noted earlier today! Collectively stacked configurations remain positioned above current pricing reinforces persistent overhead supply zones existing right now making things difficult moving forward without clear breakouts occurring anytime soon either way!
Bullish Perspective:
If Bitcoin can maintain its position above support levels set near Sixty-five Thousand Nine Hundred despite ongoing pressures stemming from declining MAs then chances exist where upside recoveries could occur if reclaiming regions located between Sixty-Seven Thousand Five Hundred-Eighty Eight Thousands prove successful especially when paired together with higher volumes coming through during trades taking place afterwards leading into next week’s events scheduled ahead potentially shifting sentiments positively going forth thereafter ! Confirmed higher lows appearing alongside breaks breaking through immediate resistances would shift short-term structures opening pathways retesting ranges previously established prior hitting those targets again later next month possibly forcing reassessments surrounding broader biases held against cryptocurrencies generally speaking all together collectively combined under these circumstances encountered recently !
Bearish Perspective:
The prevailing technical framework continues favoring downside risks since Bitcoins consistently traded below all major MAs spanning short-long term intervals alike including EMAs ranging anywhere from ten up until two hundreds periods examined thus far altogether confirming sell signals derived out based upon multiple factors combined leading towards lackluster bullish convictions witnessed happening lately overall trending downward still likely unless maintaining crucial supports intact otherwise exposing liquidity zones left untested risking further declines continuing extending downward trends witnessed before arriving here ultimately affecting trader decisions heavily impacting future outcomes regarding positions taken relative compared against historical patterns established beforehand already looking bleak given current scenarios unfolding accordingly amidst everything else occurring concurrently right now presently everywhere else too globally speaking beyond just crypto markets alone itself altogether!!