Significant Decline in Bitcoin Demand
According to recent findings from BGeometrics, there has been a notable decrease in the demand for Bitcoin, with the BGeometrics Demand Index dropping to 31—its lowest point in several weeks. This downturn aligns with Bitcoin’s price falling to approximately $110,842, indicating an increasing gap between market interest and price stability.
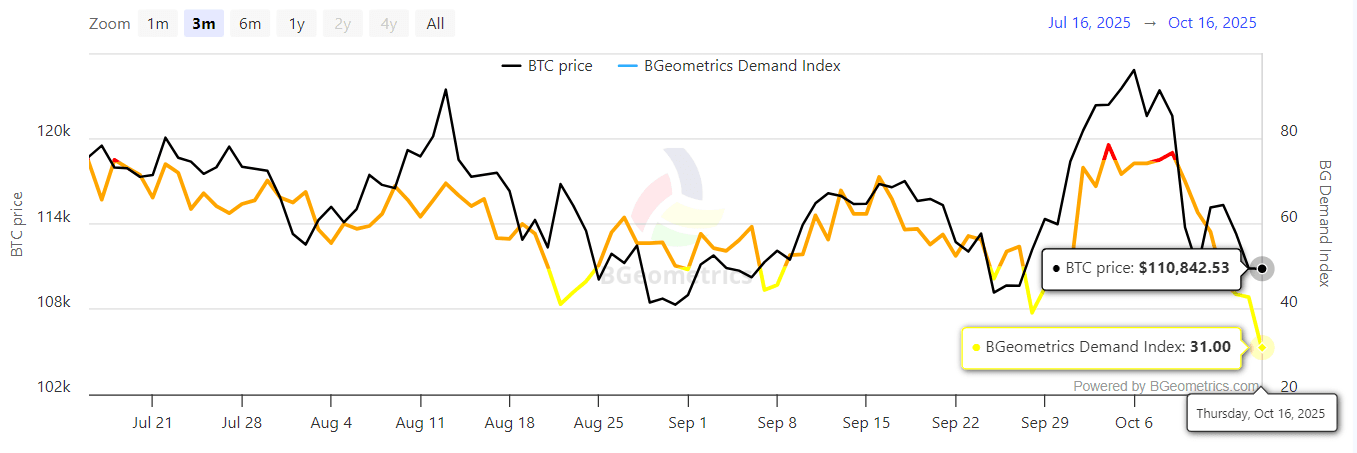
BTC demand index – BGeometrics
The demand curve serves as a gauge of network and trading activity against market appetite and is often seen as a precursor indicator. A decline in demand implies that traders are less inclined to purchase at current prices—a red flag that can foreshadow more significant price corrections.
Exploring Supply and Demand Interactions
The valuation of Bitcoin is fundamentally determined by the interplay between supply and demand—one of the foundational concepts of economic theory.
When there is an increase in demand (more buyers than sellers), prices rise as buyers compete for limited availability.
Conversely, when there’s a decrease in demand (more sellers than buyers), prices fall until balance is restored.
In contrast to conventional assets, Bitcoin’s total supply is capped at 21 million coins. This fixed supply means that fluctuations in demand play a crucial role in driving short-term volatility. As such, sharp drops in the demand index can significantly influence BTC’s pricing direction since fewer participants are available to absorb selling pressure.
An Analysis of Current Bitcoin Prices: BTC Faces Challenges Near $110K
The most recent daily chart for Bitcoin illustrates this declining trend:
$BTC trades around $110,339 while remaining just above its 200-day Simple Moving Average (SMA) at $107,419—a vital long-term support threshold.
The 50-day SMA now stands at $114,408 acting as robust resistance against upward movements.
Repeated attempts have failed to reclaim the range between $112K–$114K zone signifying diminishing bullish momentum.
If it closes consistently below $111K this could lead towards retesting levels around $107K or even down to $104K if negative sentiment escalates further.
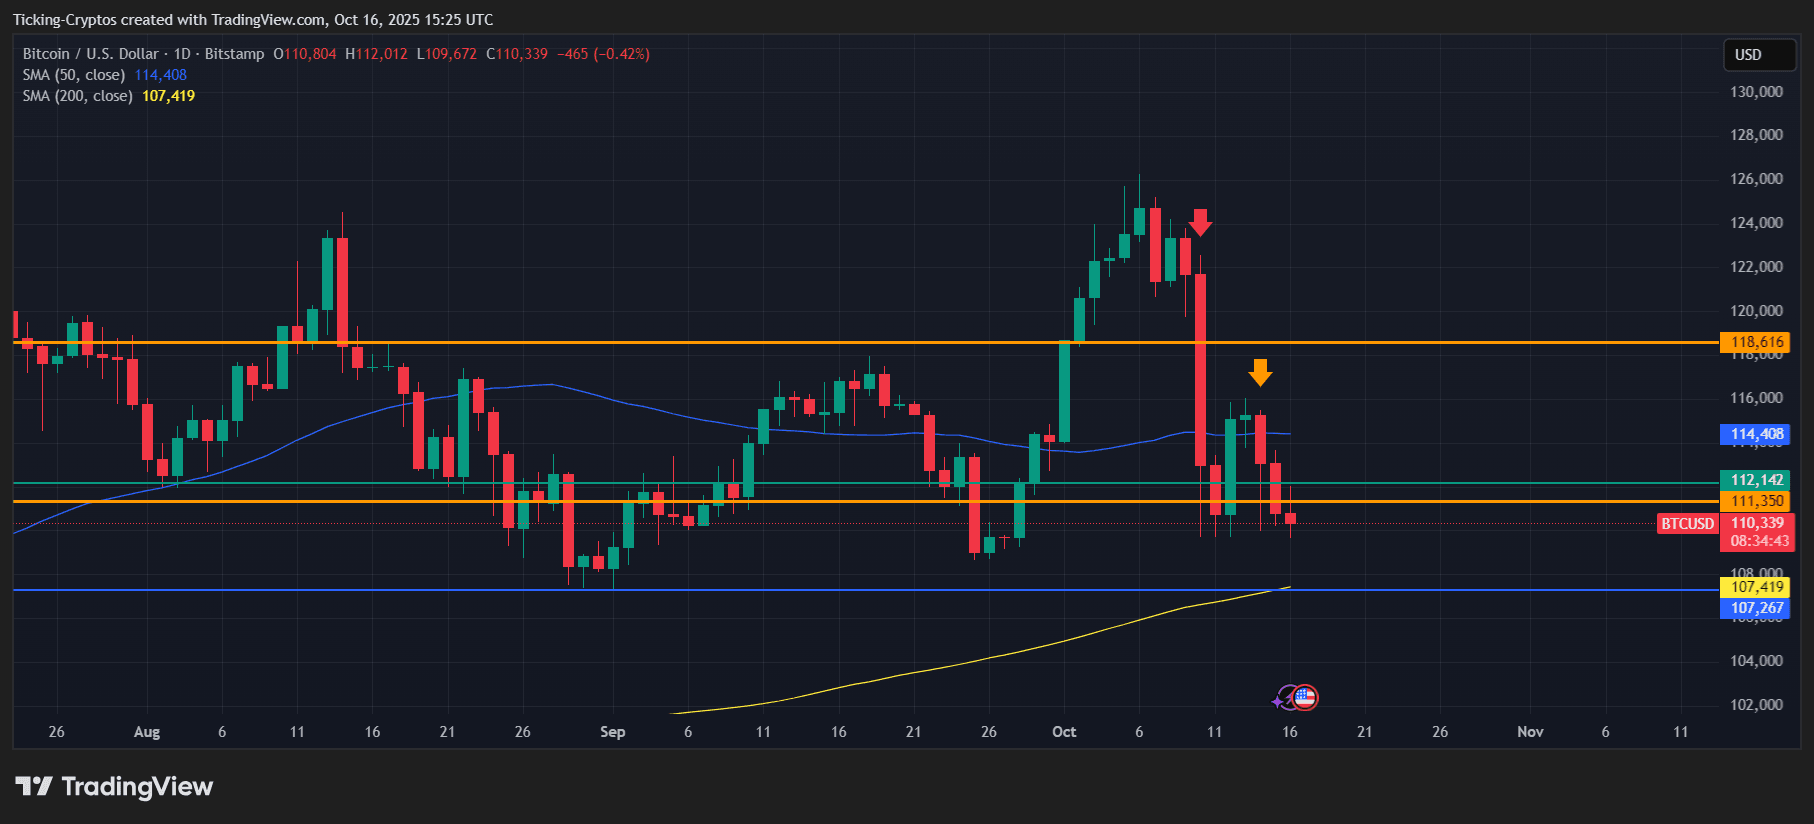
BTC/USD daily chart – TradingView
At present moment, any recovery for Bitcoin hinges on renewed buying interest. Without an influx of new demands any temporary uptick will likely encounter selling pressure near the resistance level around $114K.
The Future Outlook for Bitcoin: Anticipating What Comes Next
If trends continue downward on the BGeometrics Demand Index front; it may indicate sustained bearish control over short-term pricing dynamics. However should stabilization occur followed by an upward rebound; it could signal initiation into consolidation before embarking on another major movement phase.
Traders should monitor:
Demand Index recovering above 50 → potential bullish reversal
Break below support level at 107k → likely continuation toward target near 102k
Lackluster demands suggest ongoing market caution; potentially waiting for clearer macroeconomic indicators prior committing capital into new positions.