
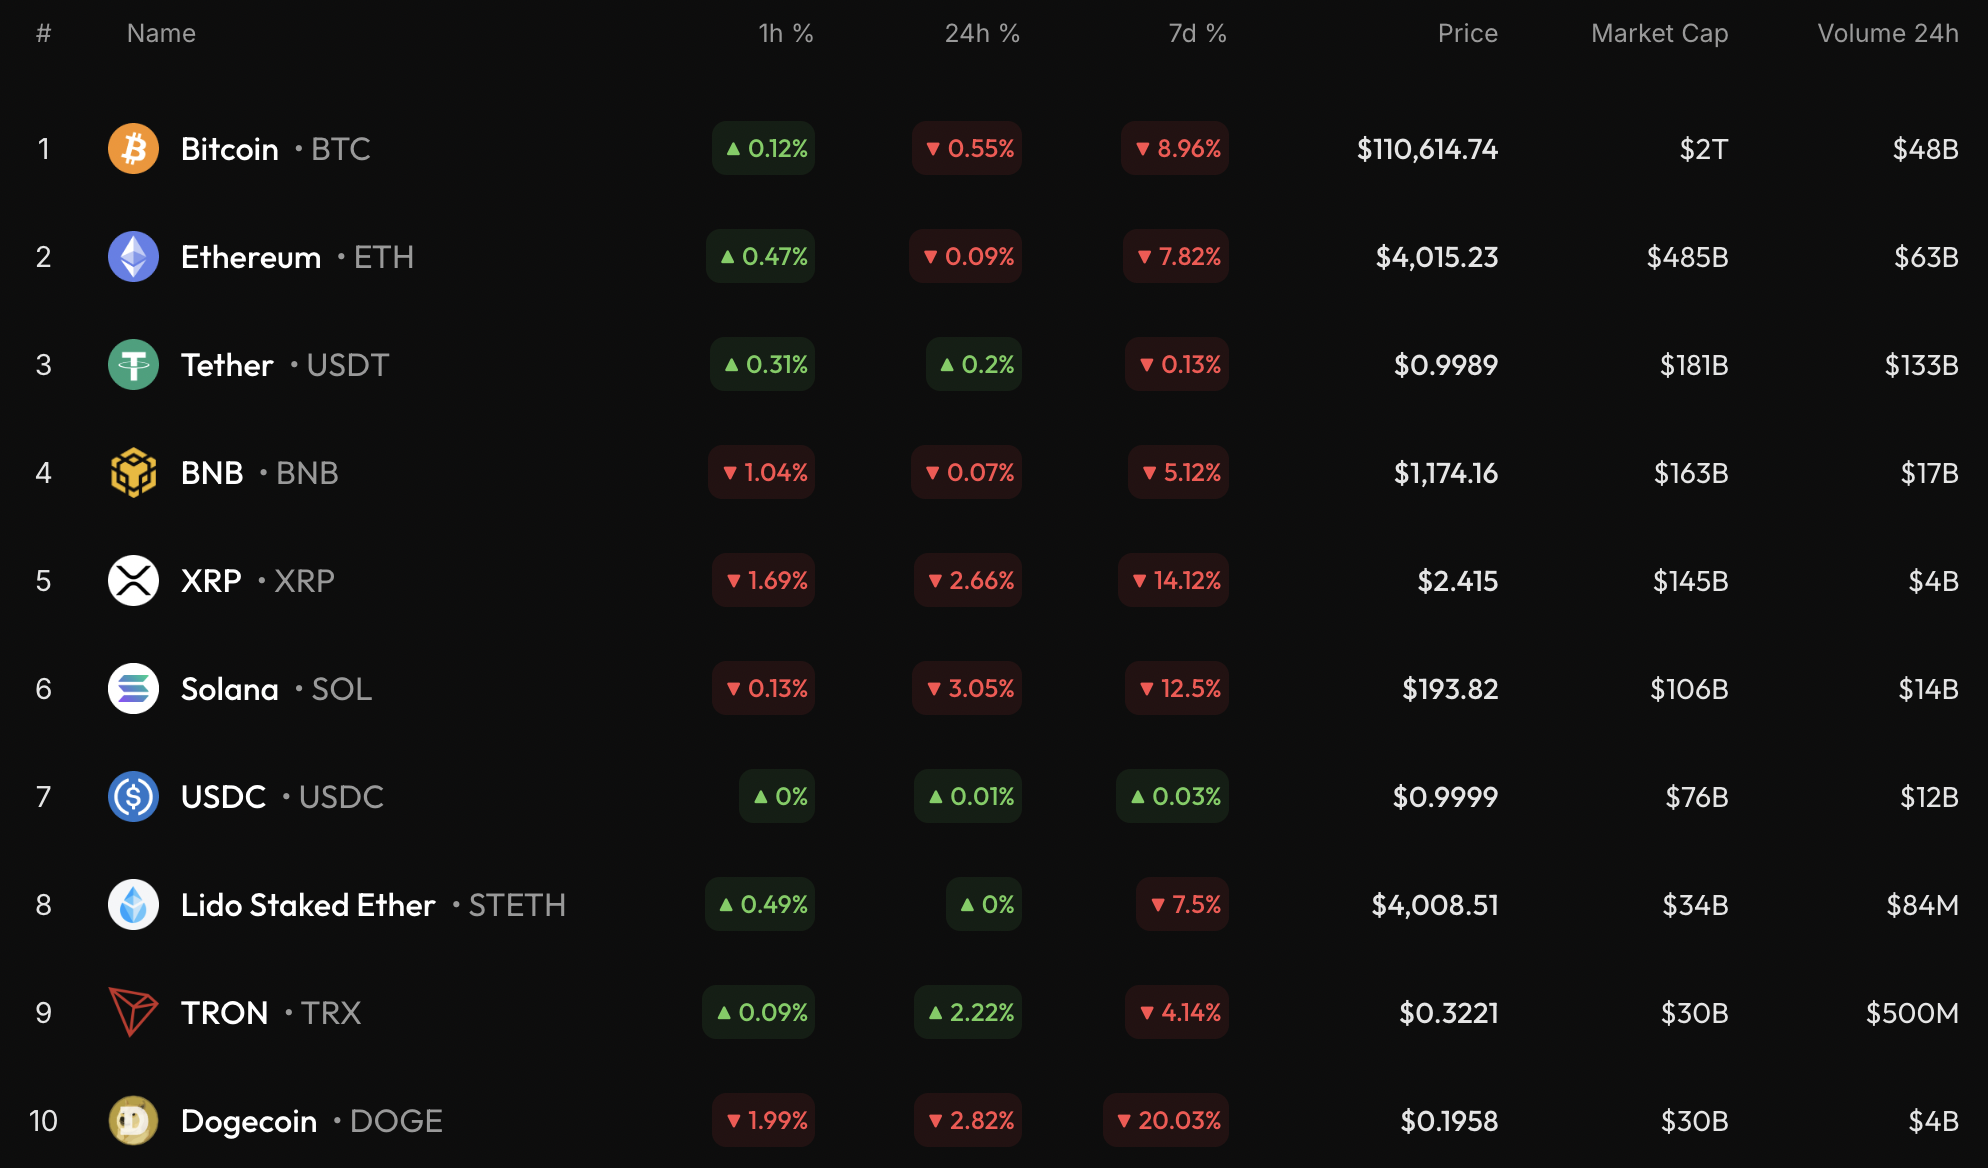
According to CoinStats, while the majority of cryptocurrencies are experiencing a downturn, there are a few notable exceptions.
BTC/USD
The value of Bitcoin (BTC) has decreased by 0.55% compared to yesterday’s figures.
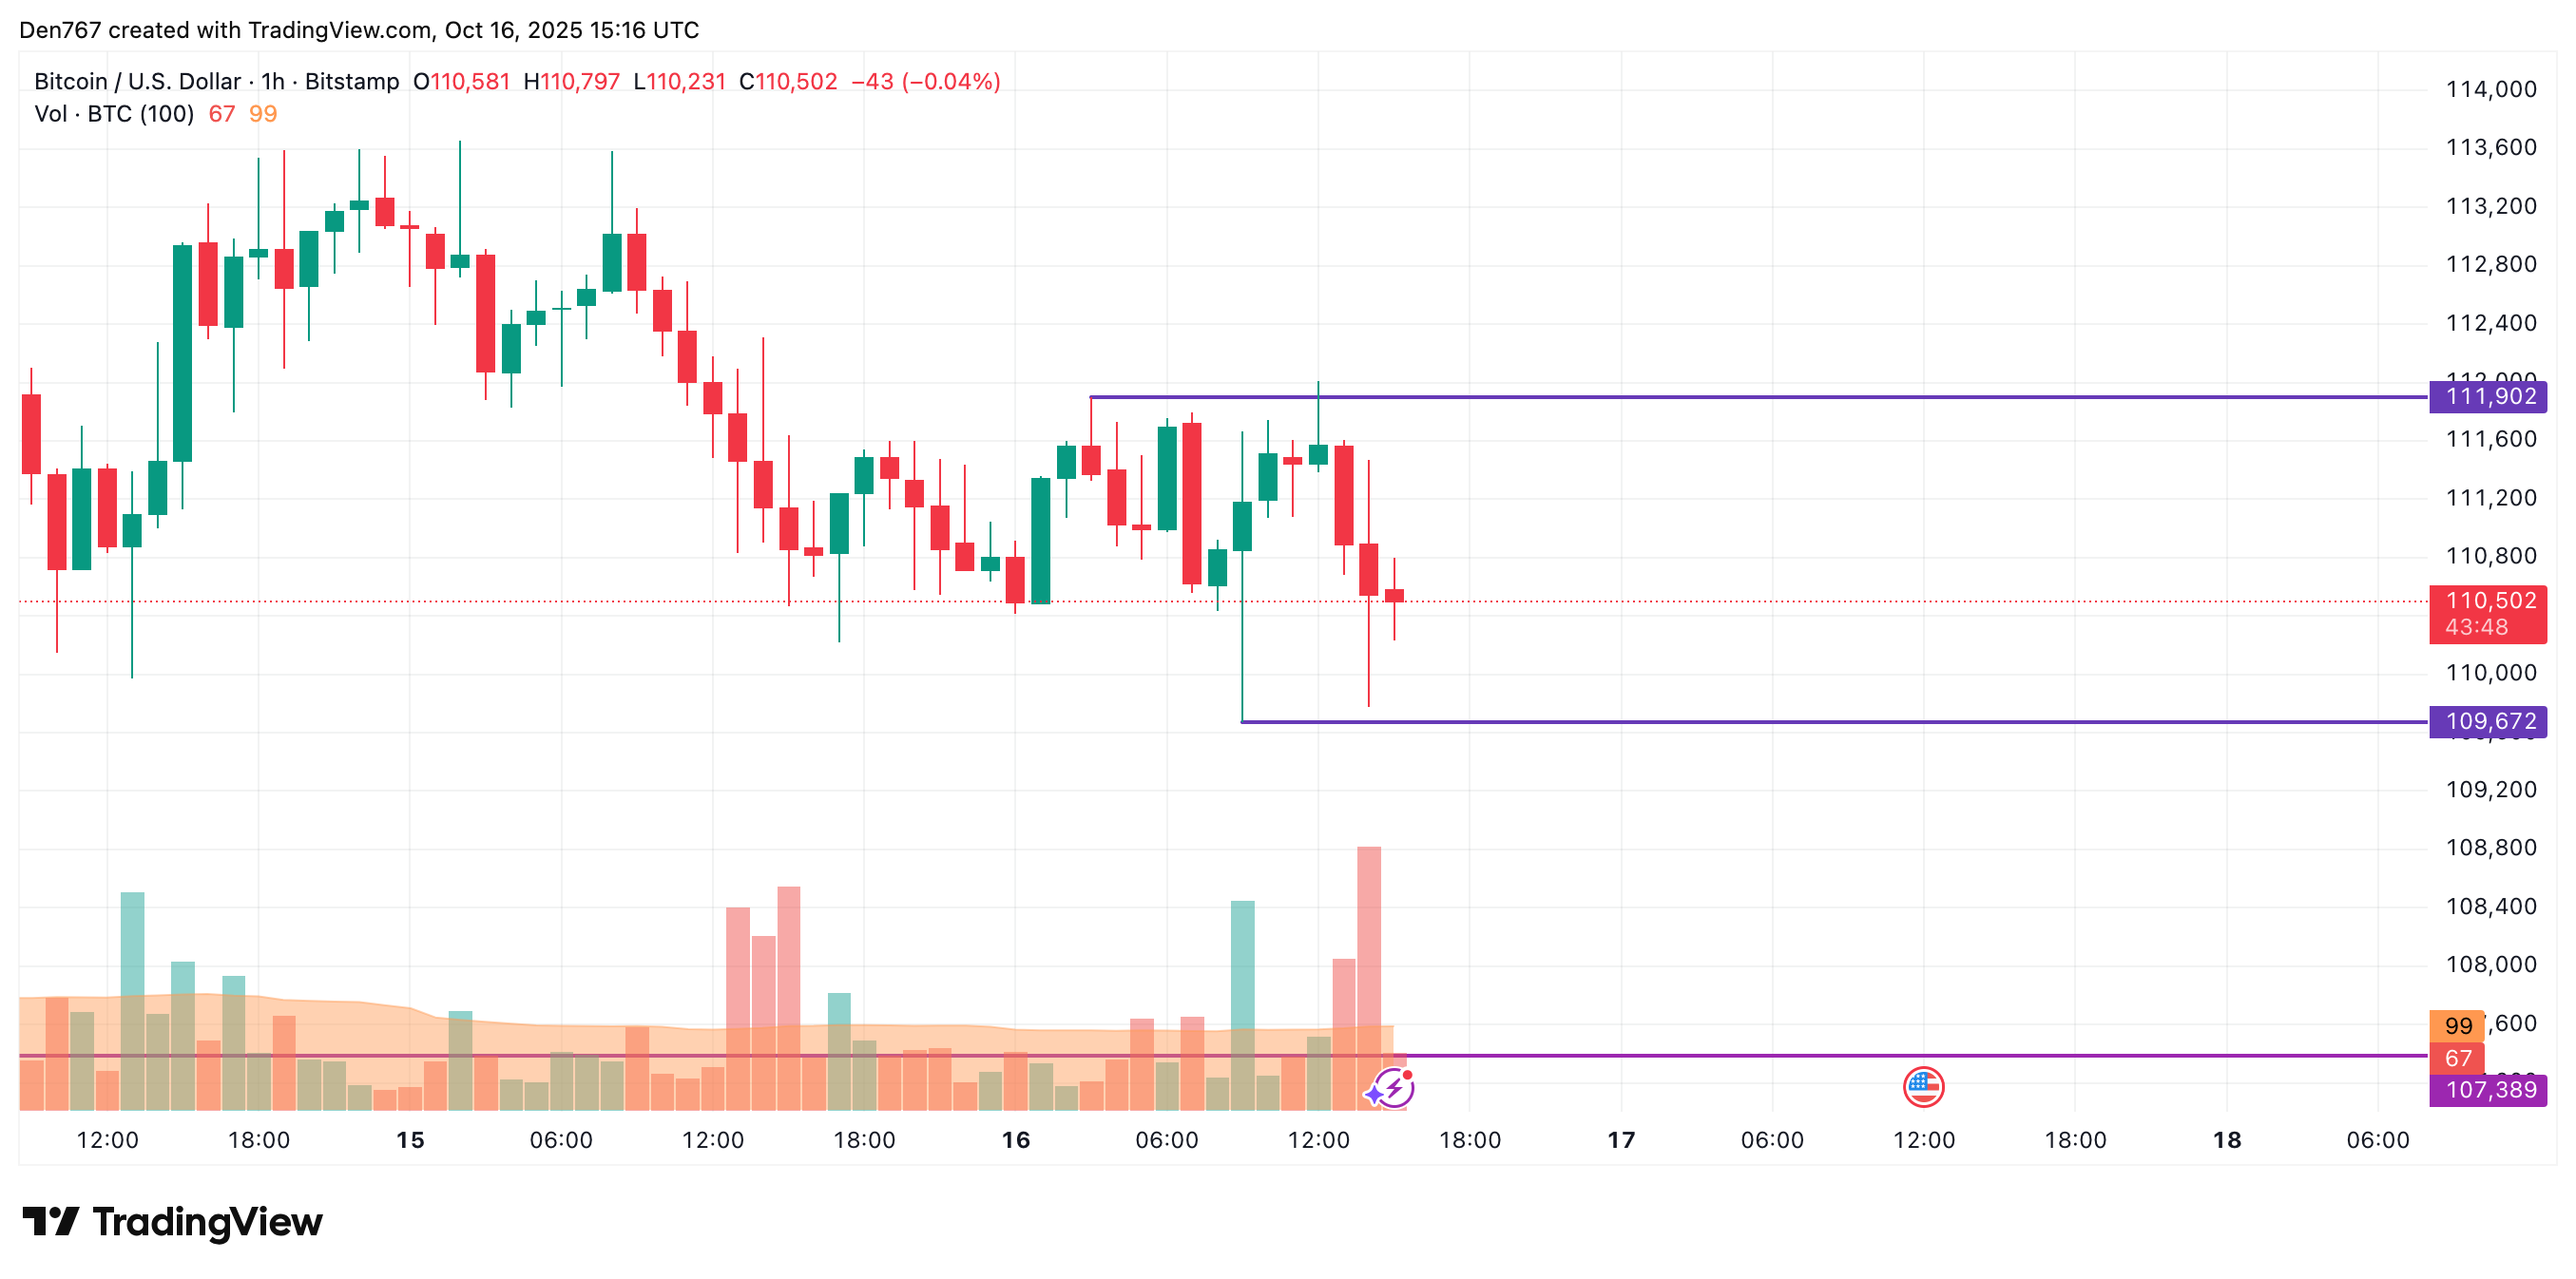
Analyzing the hourly chart reveals that BTC is on a downward trend following a false breakout at the local resistance level of $111,902. If conditions remain unchanged by day’s end, we could see further corrections down to around $109,000.
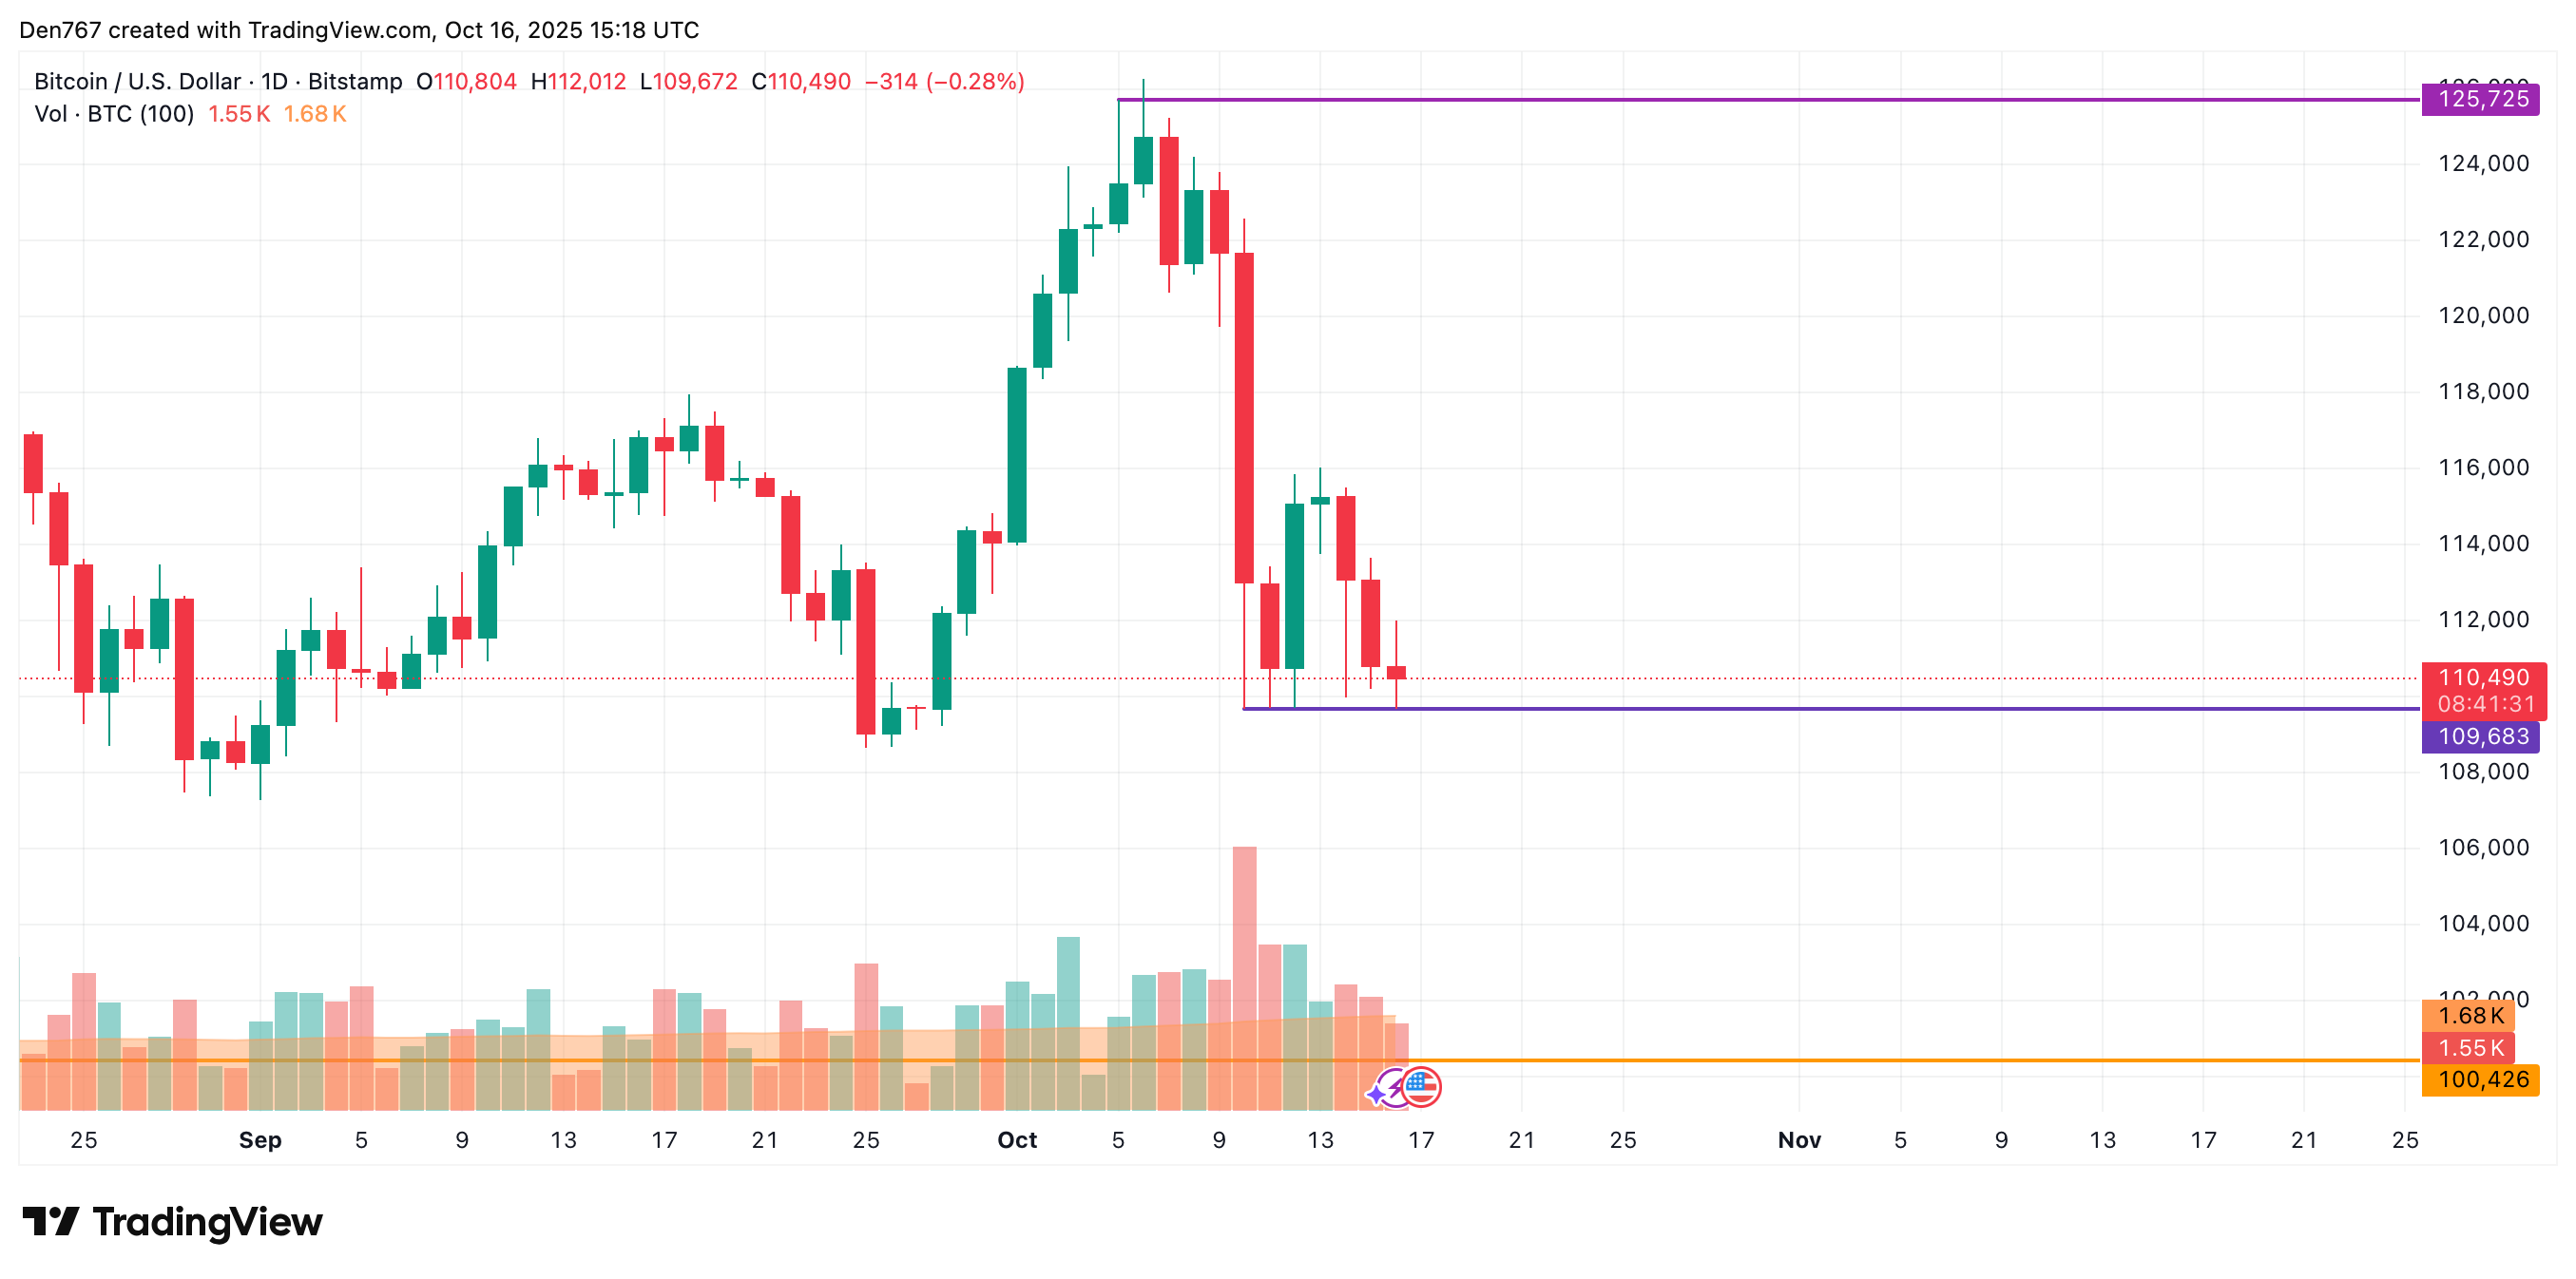
Looking at longer time frames, Bitcoin has tested its support level at $109,683. Should today’s candle close near or below this point, it may generate enough momentum for another test in the range of $108,000-$109,000.
From a midterm perspective, there have yet to be any signals indicating a reversal. Therefore it’s crucial to monitor how the weekly bar closes relative to the $107,389 mark; if this level is breached it could lead us towards declines reaching around $100,000.
As of now , Bitcoin is trading at approximately $110 ,459 .