
The current Bitcoin market cycle may be approaching a peak, according to historical post-halving patterns observed by a prominent market analyst.
The analyst, Quinten, highlighted that in each of the last three cycles, market tops emerged within a defined number of days following the halving.
Bitcoin’s Cycle Timing Across Halvings
Data from his chart shows that the 2012 halving triggered Bitcoin’s earliest parabolic rally, culminating just over a year later. The 2016 halving cycle extended for nearly a year and a half before topping out. In 2020, the timeline was similar, with the peak arriving just beyond the 540-day mark.
Uptober Narrative: Bitcoin Could Rally in Q4
While the halving window frames the cycle, seasonal psychology has historically amplified price action. Analysts often refer to “Uptober,” the start of Q4 when Bitcoin’s performance shifts into higher gear. The very narrative of October rallies attracts buyers, and subsequent momentum reinforces the trend.
CryptoQuant’s SOPR chart adds evidence to this effect. The ratio, which measures whether coins are being sold at a profit or loss, consistently rises above 1 in Q4. This shows that coins change hands at a profit without overwhelming the market with selling pressure. The shift reflects a psychological cycle where early gains reinforce conviction and encourage further participation.
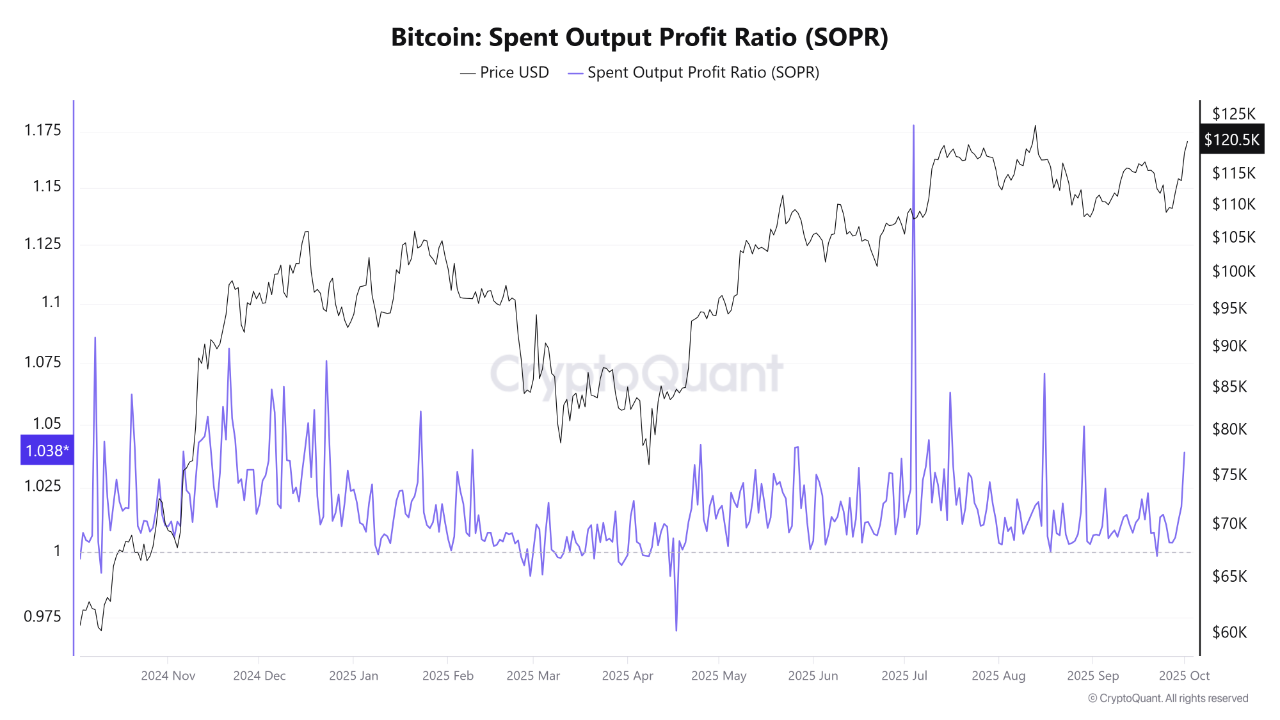
Bitcoin SOPR | CryptoQuant
Bitcoin Inflows Set to Increase
Beyond psychology, institutional activity often strengthens October rallies. Portfolio rebalancing in Q4 introduces new capital into markets, with Bitcoin increasingly positioned as a beneficiary. Macro conditions, from Federal Reserve policy adjustments to U.S. election cycles, often coincide with heightened risk appetite.
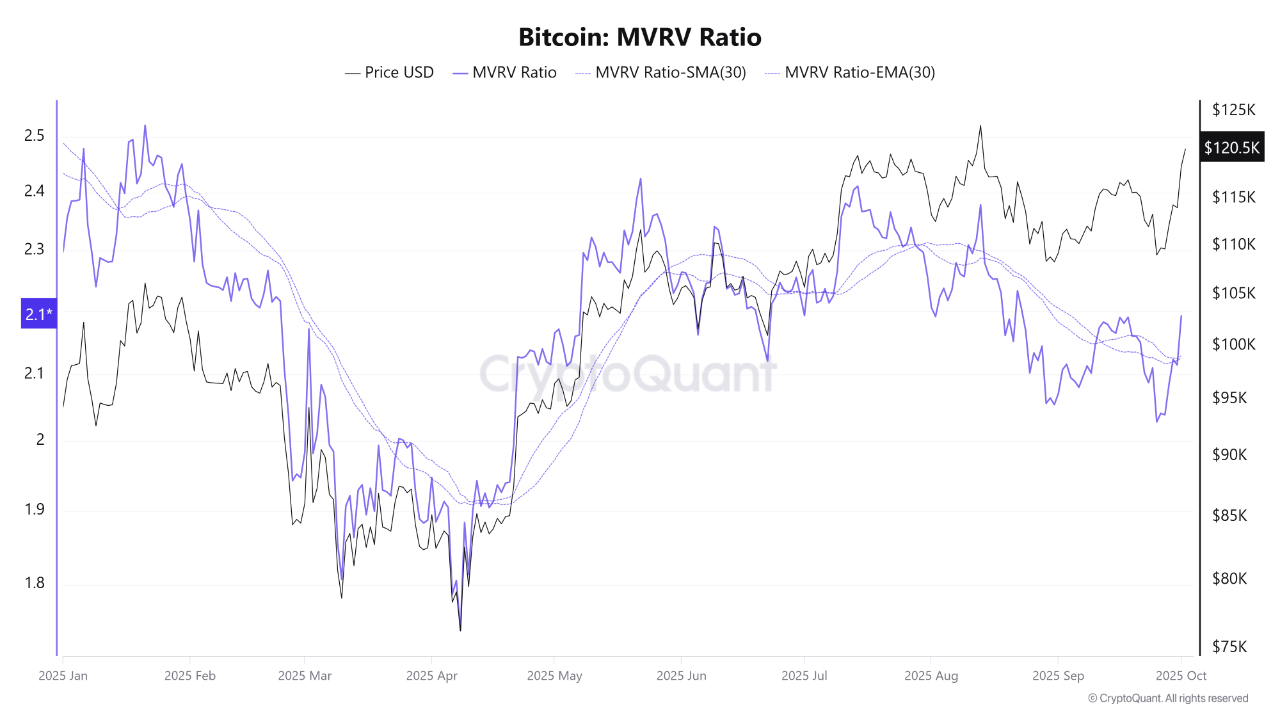
Bitcoin MVRV Ratio | CryptoQuant
These flows layer onto the halving-driven supply dynamics, magnifying their effect. While halvings create structural scarcity, capital inflows during Q4 provide the demand side of the equation.
The MVRV ratio, which compares Bitcoin’s market value to its realized value, shows this alignment. Notably, current readings hover around 2.1, signaling expanding unrealized profits. This level has historically represented the middle stage of bull cycles, well before overheated conditions above 3.0 emerge.
The steady rise in MVRV suggests that conviction among holders is strengthening, while the structural demand implied by declining exchange balances points to accumulation rather than short-term trading.