Bitcoin is presently valued at $87,906, boasting a market cap of approximately $1.75 trillion. Over the last 24 hours, trading activity has reached $54.01 billion, with the price oscillating narrowly between $86,126 and $88,800. Despite this tight range in price movement, technical indicators suggest a more complex scenario than mere consolidation.
Analysis of Bitcoin’s Price Chart
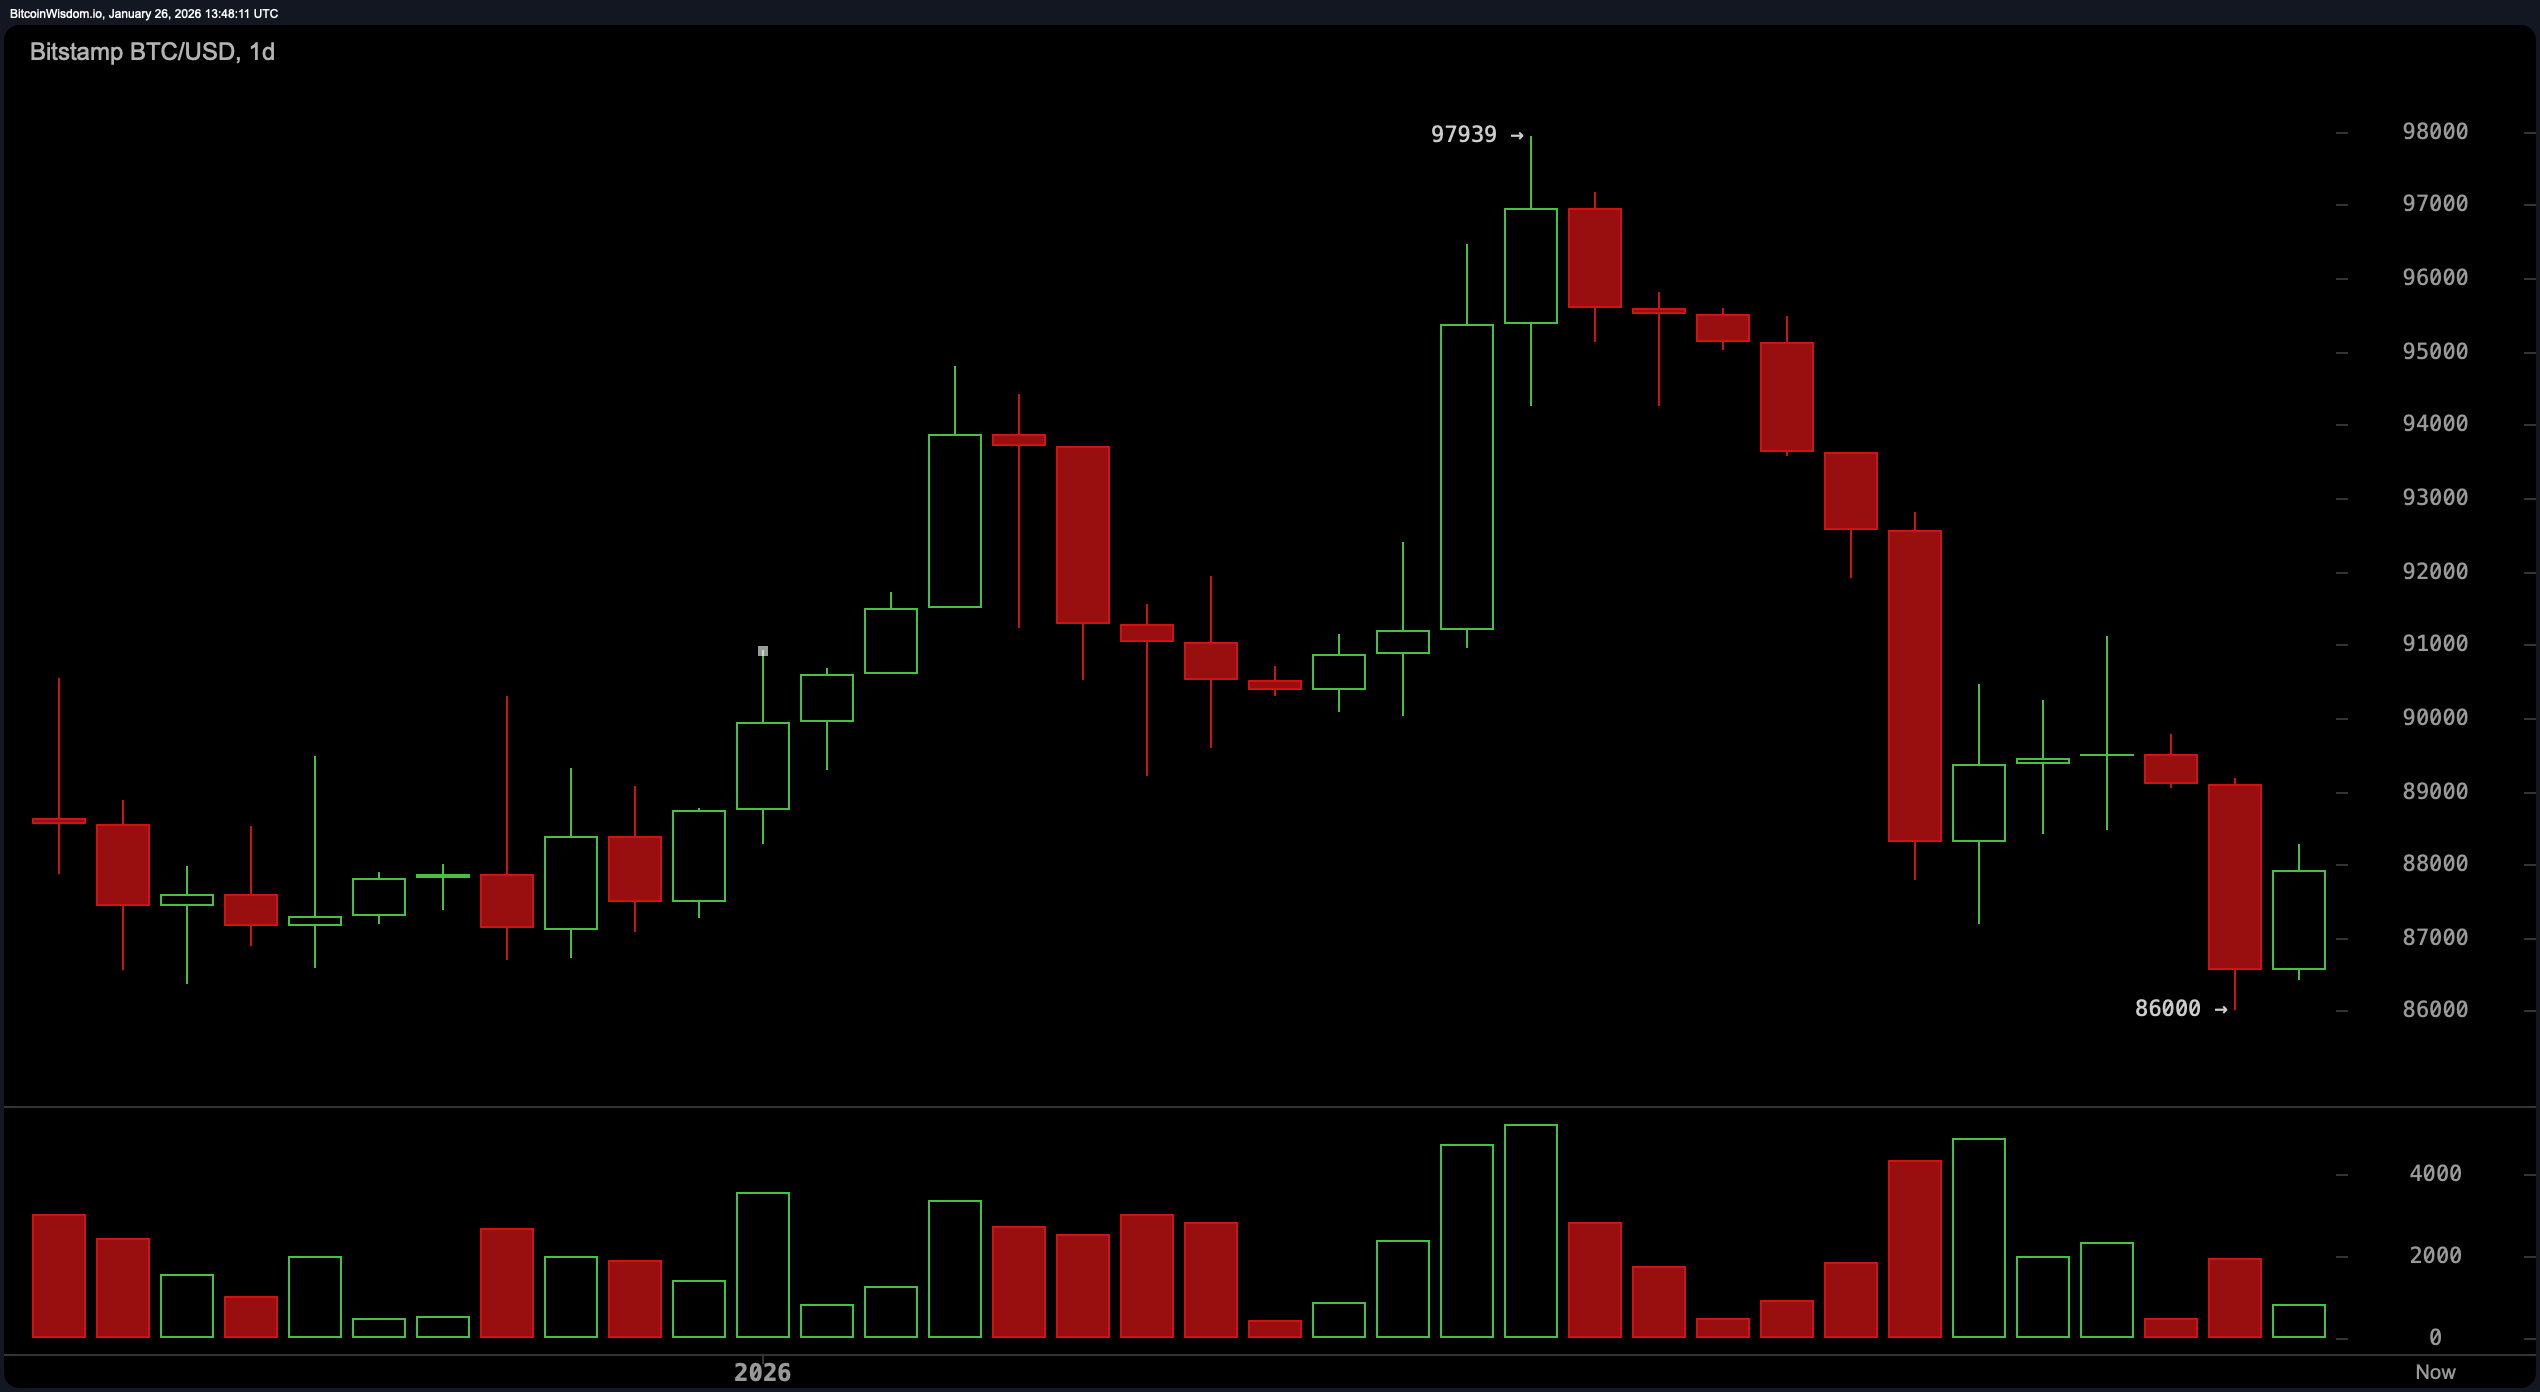
The daily chart reveals Bitcoin’s current sentiment as somewhat bearish. After failing to hold near the resistance level of around $97,939, Bitcoin plunged sharply toward the vicinity of $86,000. This drop was accompanied by a surge in volume indicative of panic selling or automated stop-loss triggers cascading through the market. In total, roughly $757 million worth of liquidations took place within 24 hours as nearly 190 thousand derivatives traders saw their positions wiped out.
A slight rebound followed; however, weak candlestick formations with small bodies imply that buying pressure remains minimal at best. The persistent pattern of lower highs and lower lows confirms that sellers continue to dominate price action.
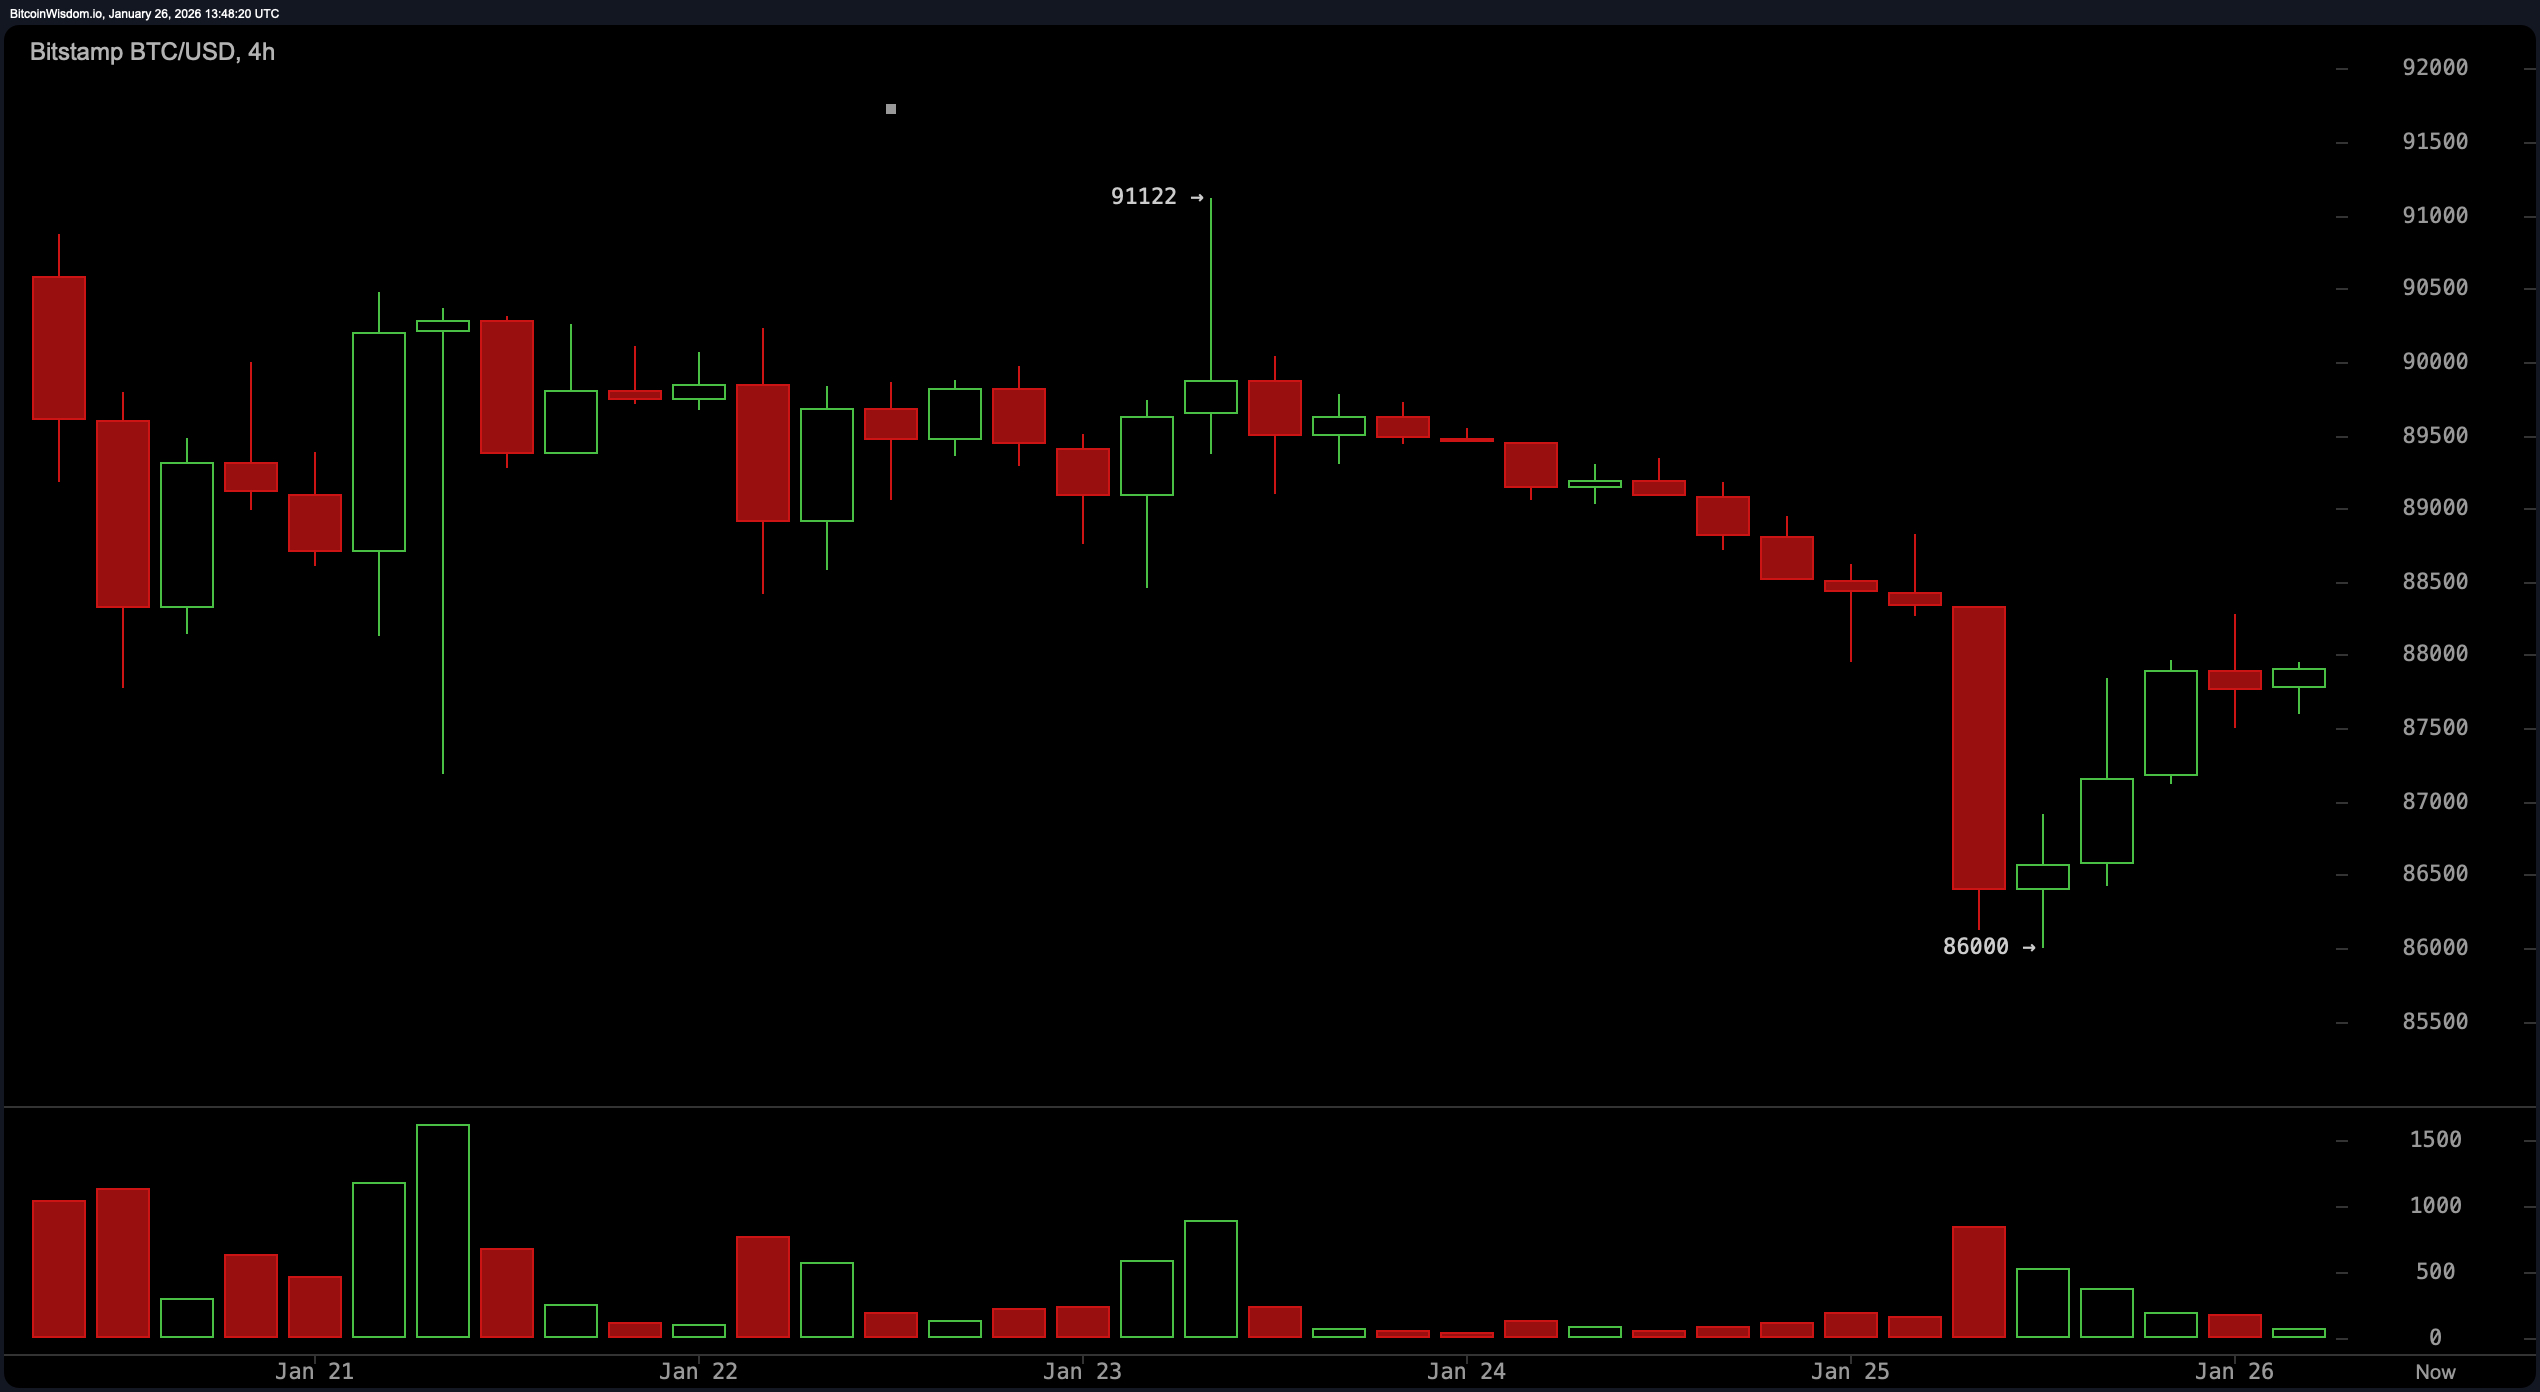
Examining the four-hour timeframe uncovers a textbook breakdown from about $89,000 down to support near $86,000 mentioned earlier. While some may interpret minor gains and higher lows afterward as hopeful signs, resistance levels between roughly $88,000 and $88,500 have proven stubbornly resilient—comparable to an unwavering crypto maximalist dismissing fiat currencies at any gathering.
The declining volume during these attempts further dampens optimism; such patterns resemble classic bear flags or bearish pennants which typically resolve with downward continuation rather than recovery.
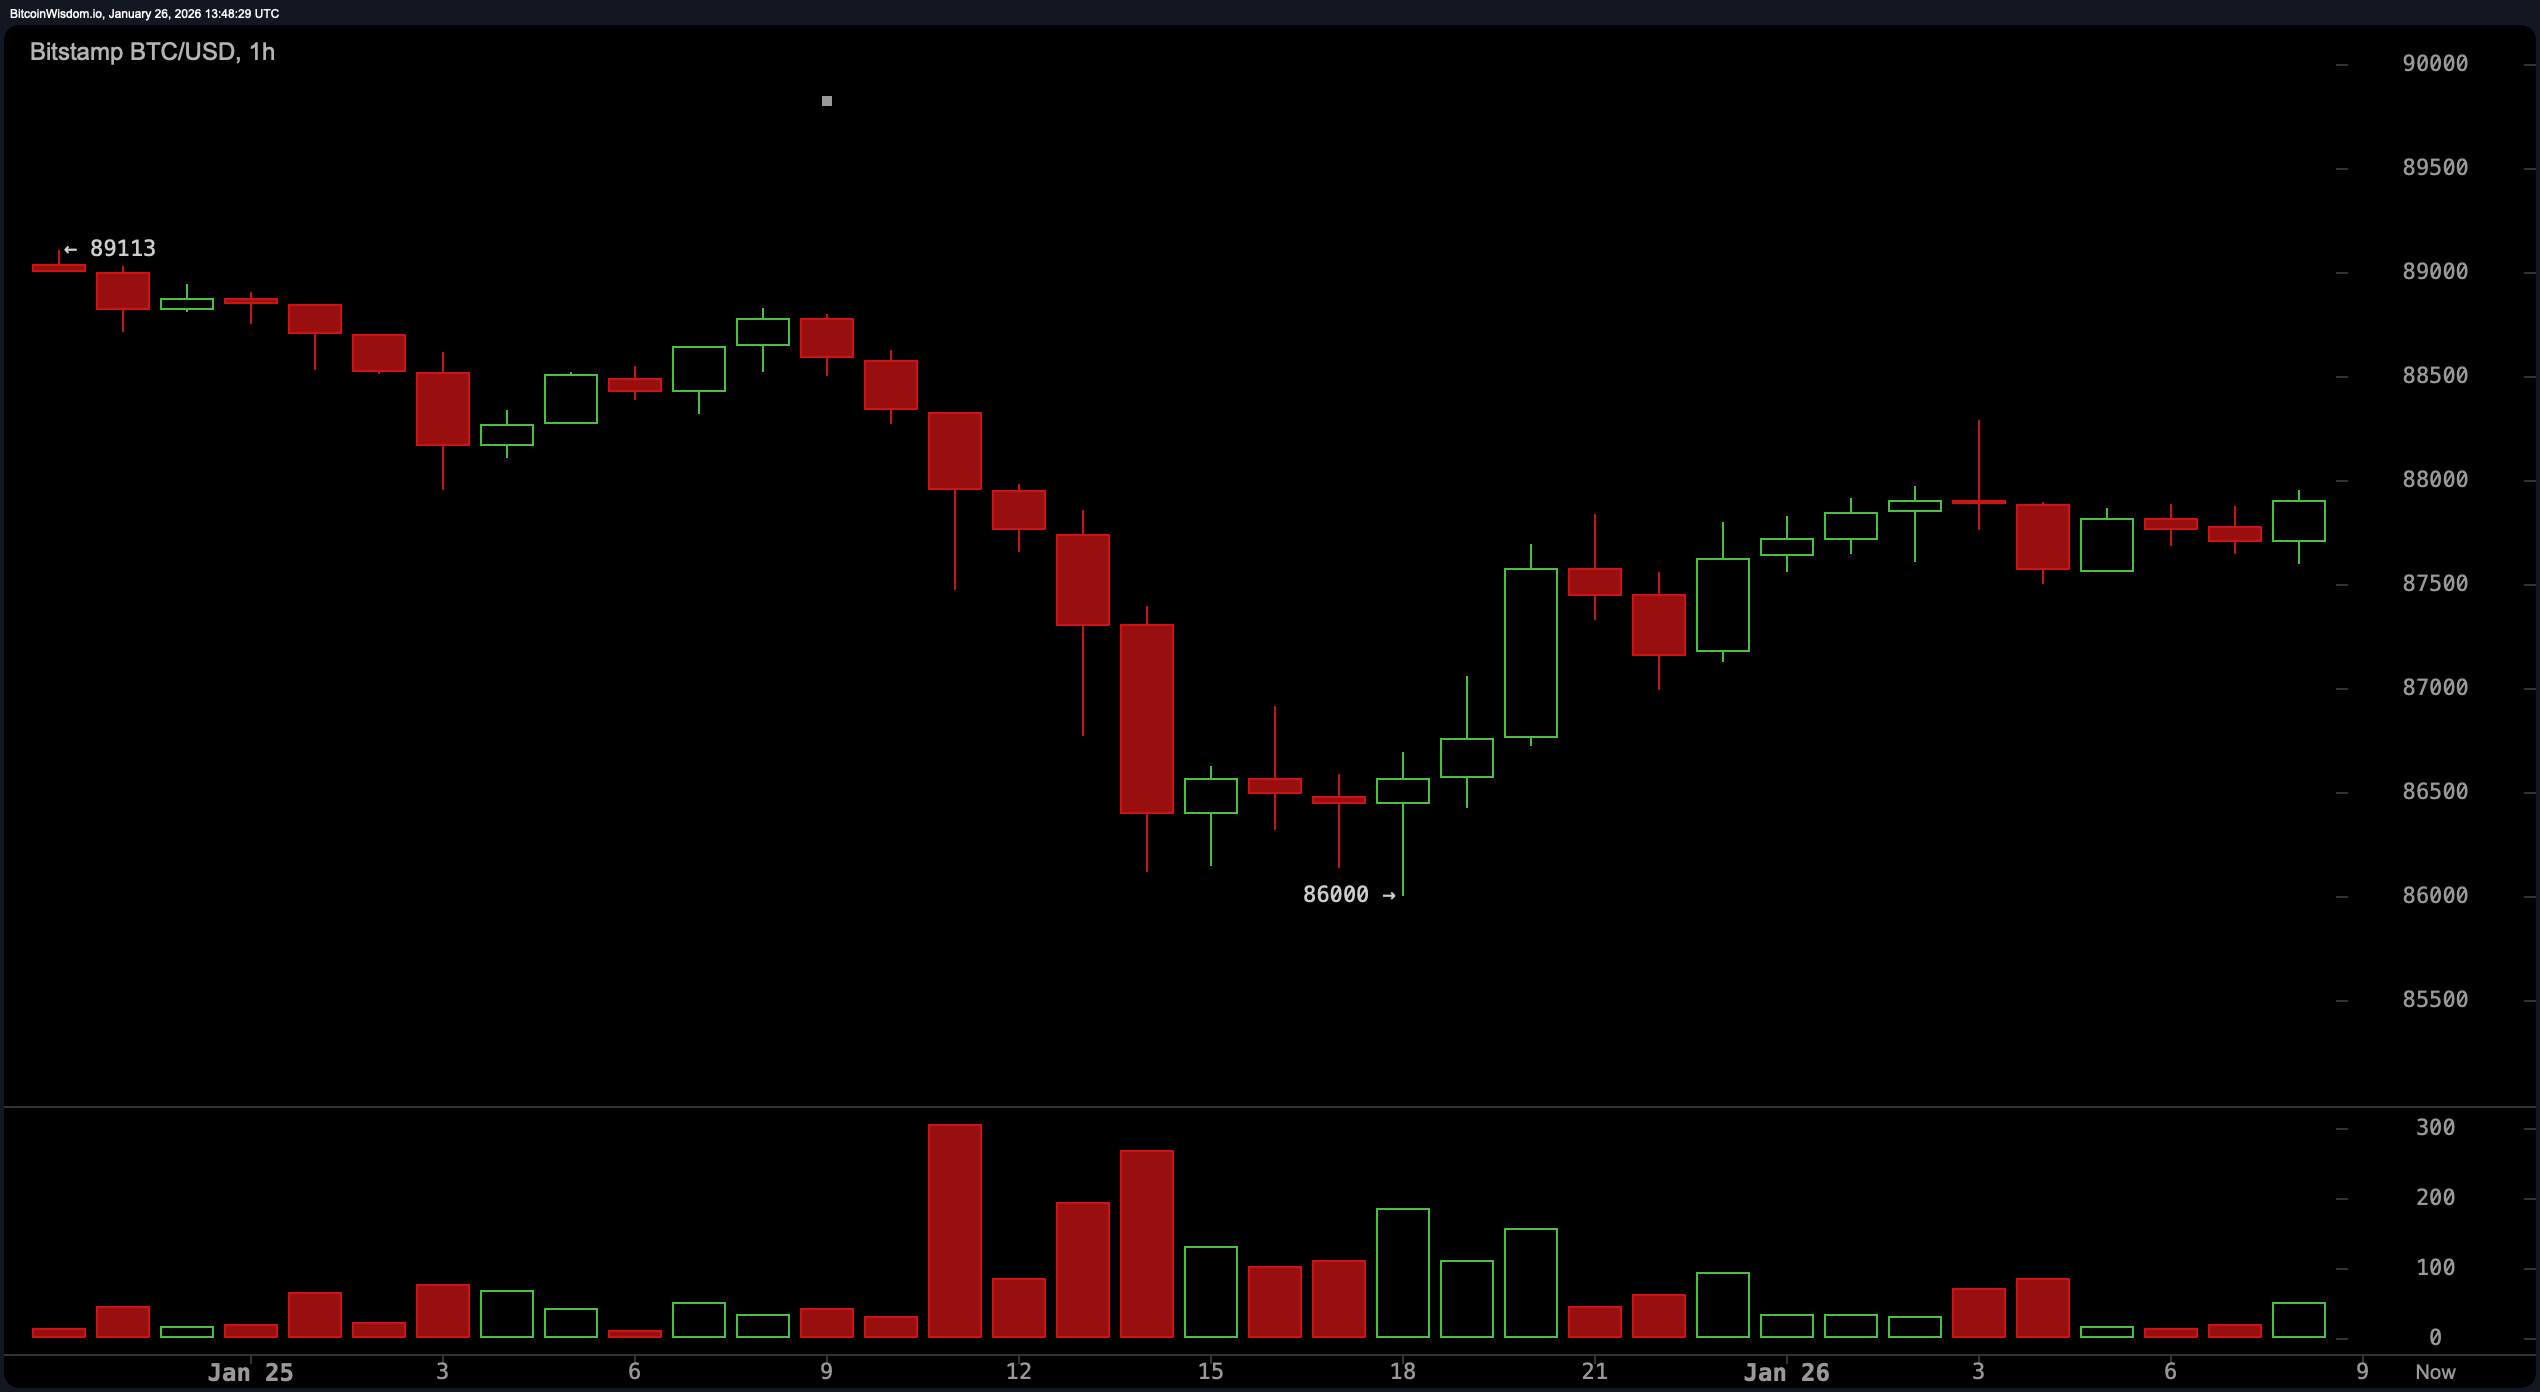
The hourly chart offers little encouragement either: Bitcoin fluctuates between approximately $86K and just below the critical resistance zone near$88K–forming what might eventually become an accumulation area but lacks conviction for now.
Volume continues dwindling without any breakout above key resistance around$88,&500 suggesting this movement resembles more a fatigued retracement instead of an authentic trend reversal.
Technical oscillators echo cautionary signals: The Relative Strength Index (RSI) rests neutrally at 41 while stochastic oscillator values hover low around13.
The Commodity Channel Index (CCI) alongside momentum indicators hint towards possible upward momentum opportunities but are overshadowed by a notably negative Moving Average Convergence Divergence (MACD) reading close to -666—a decidedly bearish indicator signaling downward pressure persists strongly.
Regarding moving averages across all timeframes—from short-term periods like10 up through long-term spans such as200—the consensus remains firmly bearish. Prices trade well beneath these averages ranging from roughly$89,&653 up to over$104,&982 indicating substantial hurdles ahead if bulls aim for sustained recovery anytime soon.
Bullish Perspective:
If Bitcoin can decisively break above strong resistance near$88,&500 supported by robust trading volumes then its current sideways consolidation could evolve into genuine bullish reversal territory.
Reclaiming levels beyond$91,&000 would strengthen confidence among buyers potentially marking an end point for recent pullbacks.
For now though bulls remain cautious observers hoping accumulation phases aren’t deceptive illusions before further declines occur.
Bearish Outlook:
The dominant technical structure favors continued downside risk.
With all major moving averages trending lower combined with weakening volume on upward moves momentum clearly tilts toward additional losses unless prices convincingly surpass key thresholds like$91,&000.
This scenario suggests current pauses represent temporary reliefs within broader downtrends rather than meaningful recoveries.
Frequently Asked Questions ❓
What is bitcoin’s present value? — “ $87,906” (as recorded on January26,&space2026).
Where does bitcoin find its main support? — “ $86,000” (serves as strong foundational support).
Which level acts as significant resistance currently? — “$88,amp500”, representing formidable overhead supply resisting upward moves).
Is bitcoin trending upwards or downwards based on charts?& #x2014 ; — ; " ; Current technical patterns including moving average alignments indicate ongoing downward trends . " ;