
The weekly Relative Strength Index (RSI) for Bitcoin is approaching levels reminiscent of the most severe bear market conditions. In a related observation, another analyst suggests that the record high achieved before the upcoming halving has altered the entire cycle timeline.
Bitcoin Approaches Uncommon Weekly RSI Lows While Maintaining Position Above 200-Week Average
Currently, Bitcoin is hovering around the $68,000 to $69,000 range on weekly charts as a crucial momentum indicator declines towards thresholds typically associated with past bearish phases. Analyst Alex Thorn (@intangiblecoins) noted that Bitcoin is nearing historically oversold conditions, with his chart indicating a weekly RSI around 15.6.
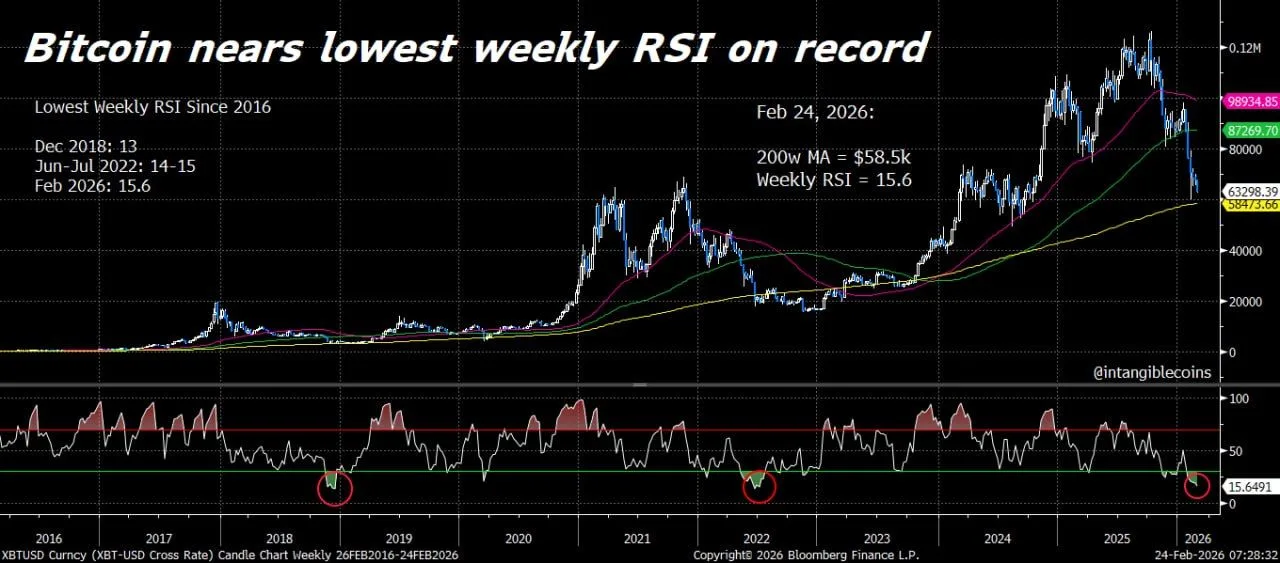
Chart of Bitcoin’s Weekly RSI and Moving Averages. Source: Alex Thorn on X (@intangiblecoins)
This analysis reveals that the current weekly RSI reading is among the lowest observed since 2016. Thorn highlighted only two previous instances where readings were lower: in November and December of 2018 when Bitcoin plummeted from approximately $6,000 to about $3,000; and during June and July of 2022 when Three Arrows Capital faced collapse followed by Genesis declaring insolvency.
Concurrently, while Bitcoin’s price remains above its 200-week moving average—approximately at $58,500—it trades below shorter-term moving averages on a weekly basis. This situation illustrates an environment characterized by significantly weak momentum reflected in the RSI while longer-term support remains intact near this key moving average line.
Analyst Claims Shift in Bitcoin Cycle Timing Following Pre-Halving Peak
Additively, Rekt Fencer (@rektfencer) contended that after reaching an unprecedented high prior to halving events, Bitcoin’s market cycle no longer aligns with traditional halving patterns. He asserted that this occurrence “disrupts the entire model” and alters traders’ typical timing windows for identifying peaks and troughs.
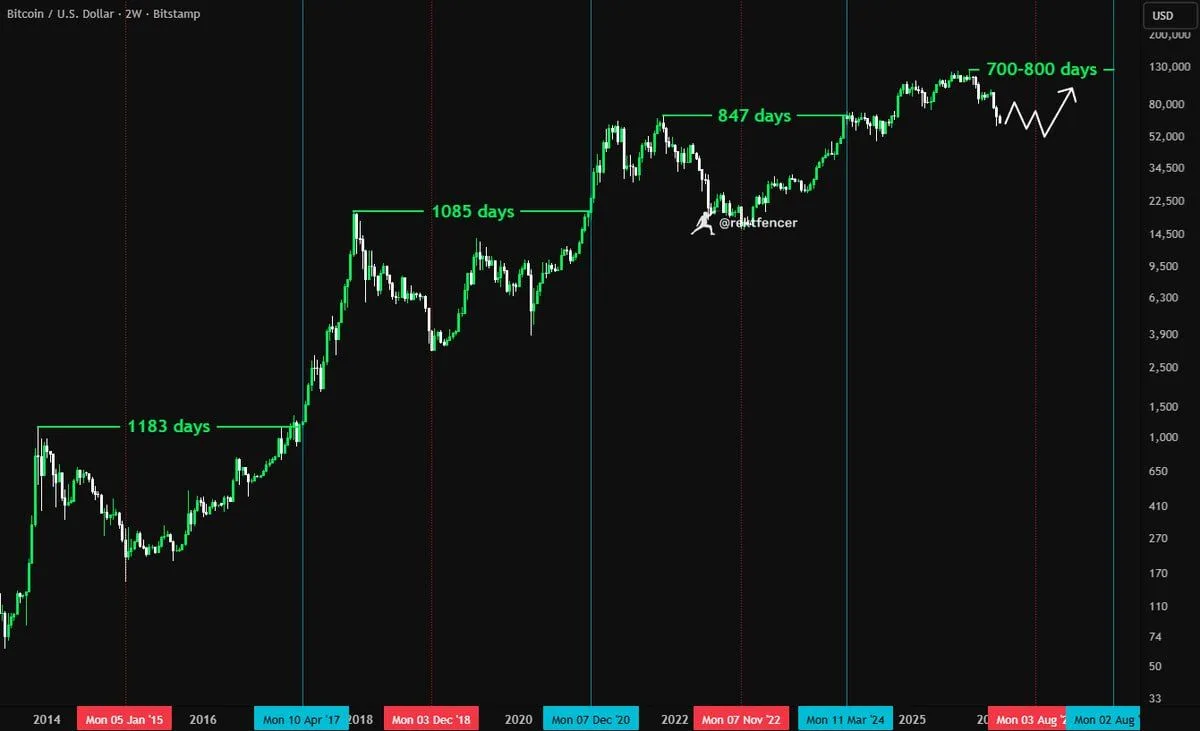
Two-Week Chart of Bitcoin Against U.S. Dollar (BTCUSD from Bitstamp). Source: Rekt Fencer on X (@rektfencer)
This chart tracks BTC against USD over a two-week period using data from Bitstamp while marking previous cycle durations with green labels—1,183 days for one phase; another lasting 1,085 days; followed by one spanning 847 days—all illustrating how long each upward trend persisted before losing momentum leading to price declines.
The analyst projected that future cycles should condense into spans ranging between 700 to 800 days instead of mirroring earlier extended timelines shown on left side of his chart due to this recent record peak which advanced both cycle highs and subsequent pullbacks within their respective timelines.
Basing his analysis on these timing adjustments suggests potential lows could emerge around July or August this year. He also drew parallels between purchasing opportunities during this current phase versus buying into deeper pullback zones witnessed in previous cycles framing it as similar stages rather than direct price comparisons.