
The Bitcoin market has settled the ongoing debate regarding its trend. At the start of the week, bearish forces attempted to drive prices down amid fund outflows. However, by the end of the week spanning May 1-3, 2026, short sellers found themselves ensnared in both technical and fundamental traps.
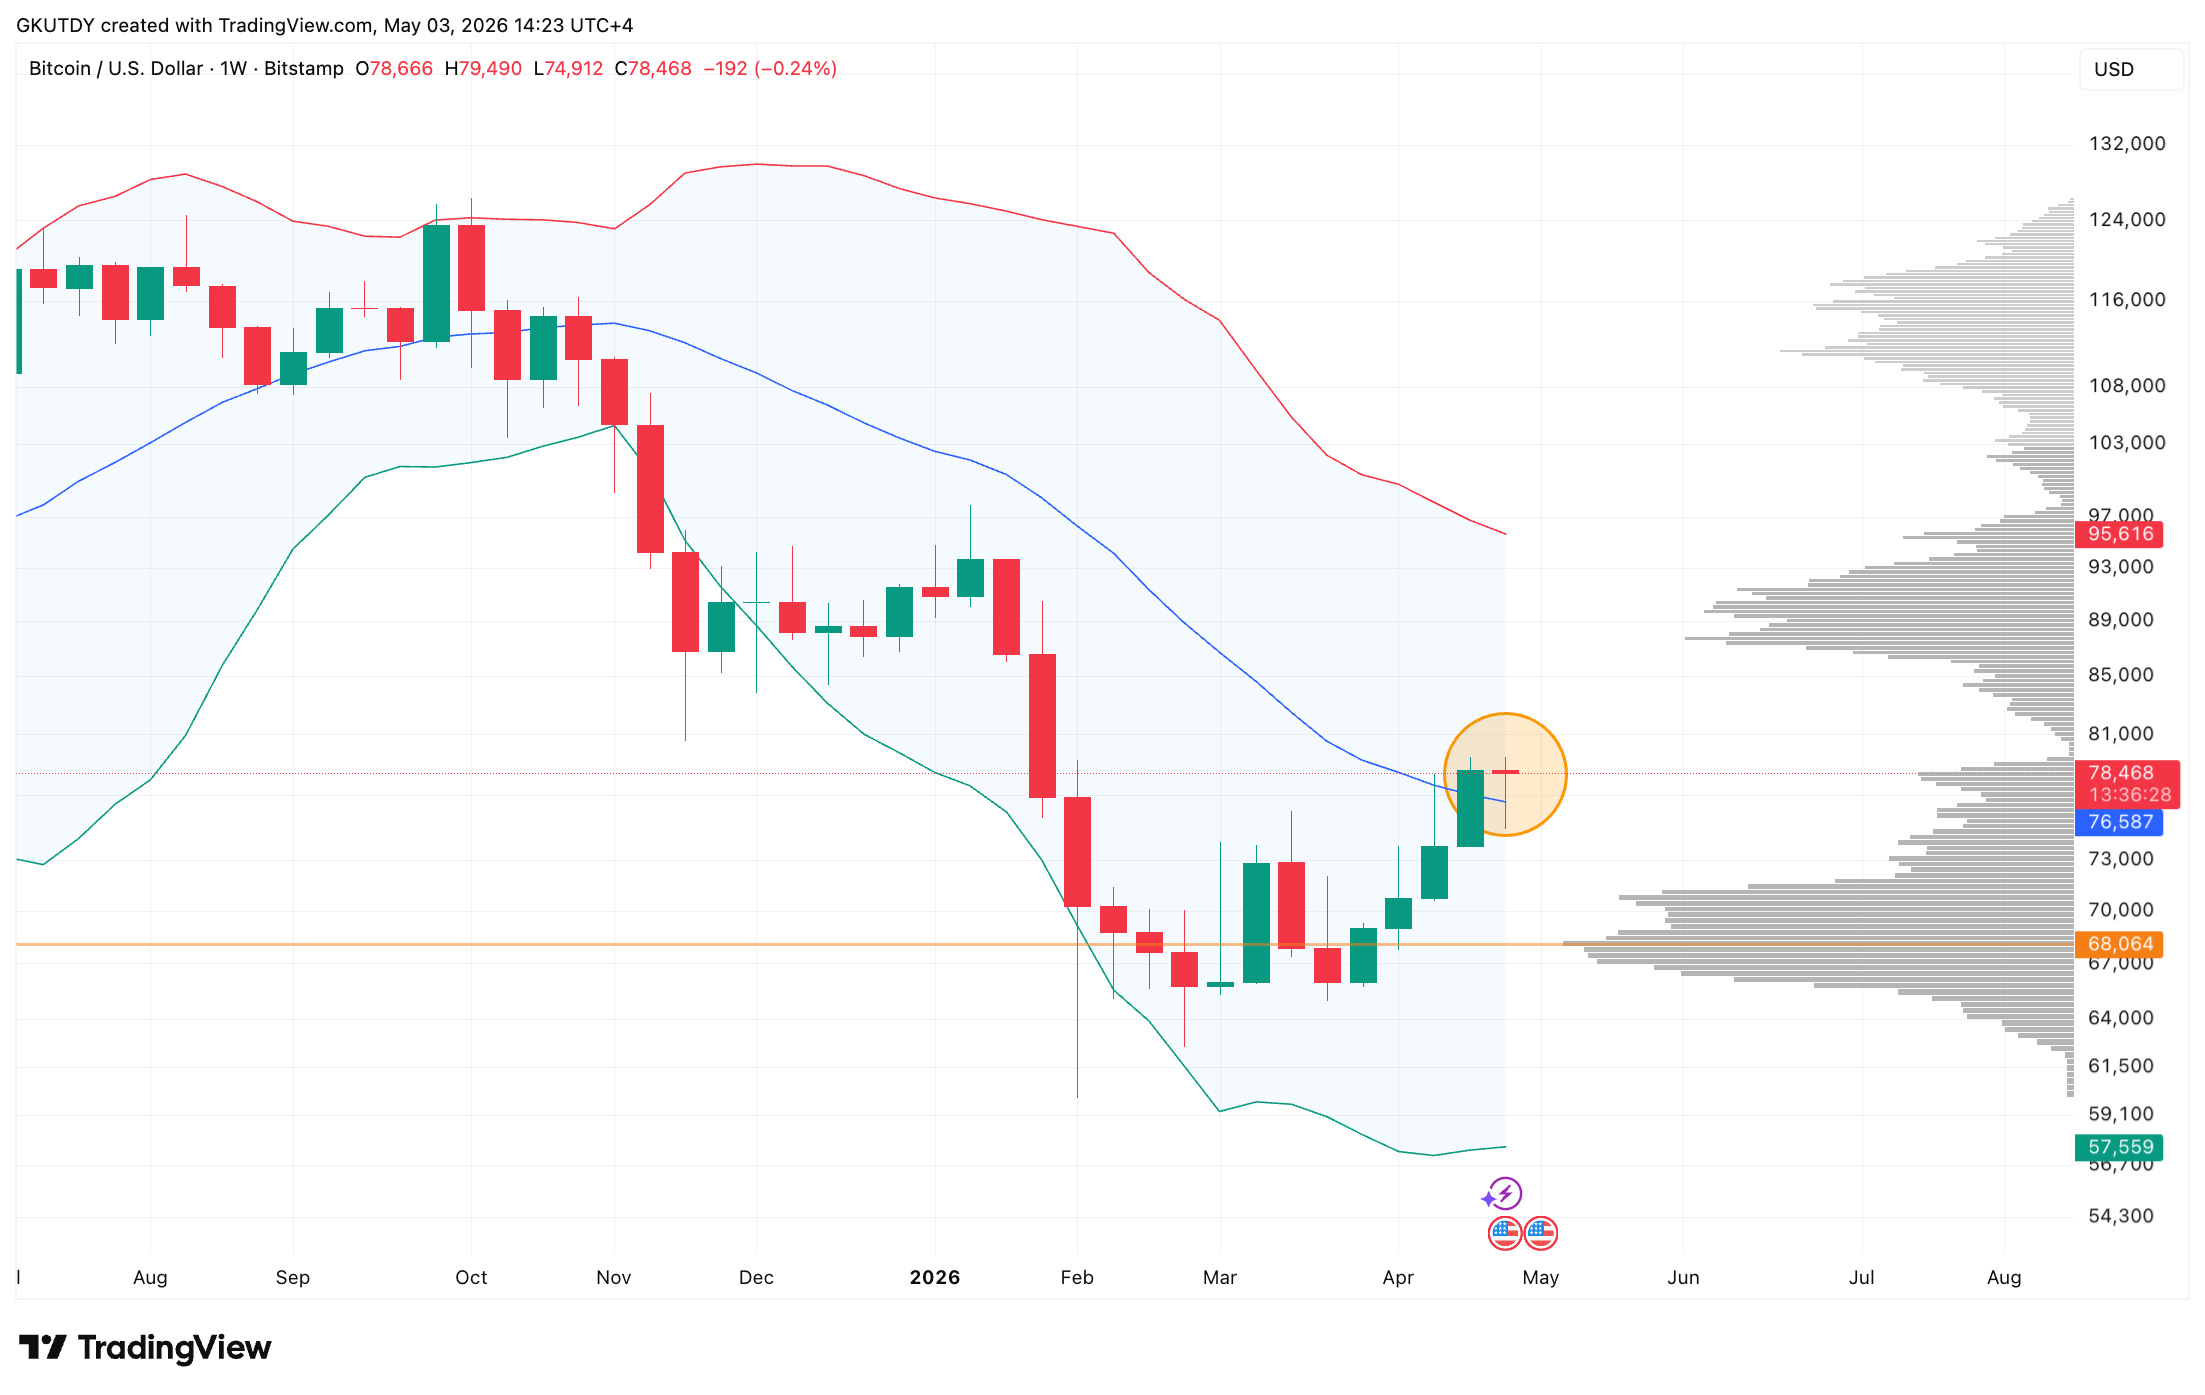
A significant highlight on the chart is a weekly candle featuring an extended lower wick. As of this writing, it is closing above the middle Bollinger Band at $76,589 according to TradingView data.
Not only did prices breach this level but they also retraced to test demand below this mid-band before bouncing back up. This long wick indicates aggressive buying activity; while retail investors hesitated, savvy investors capitalized on local dips to bolster their positions.
$630 Million ETF Inflow Sparks Major Bitcoin Bear Trap
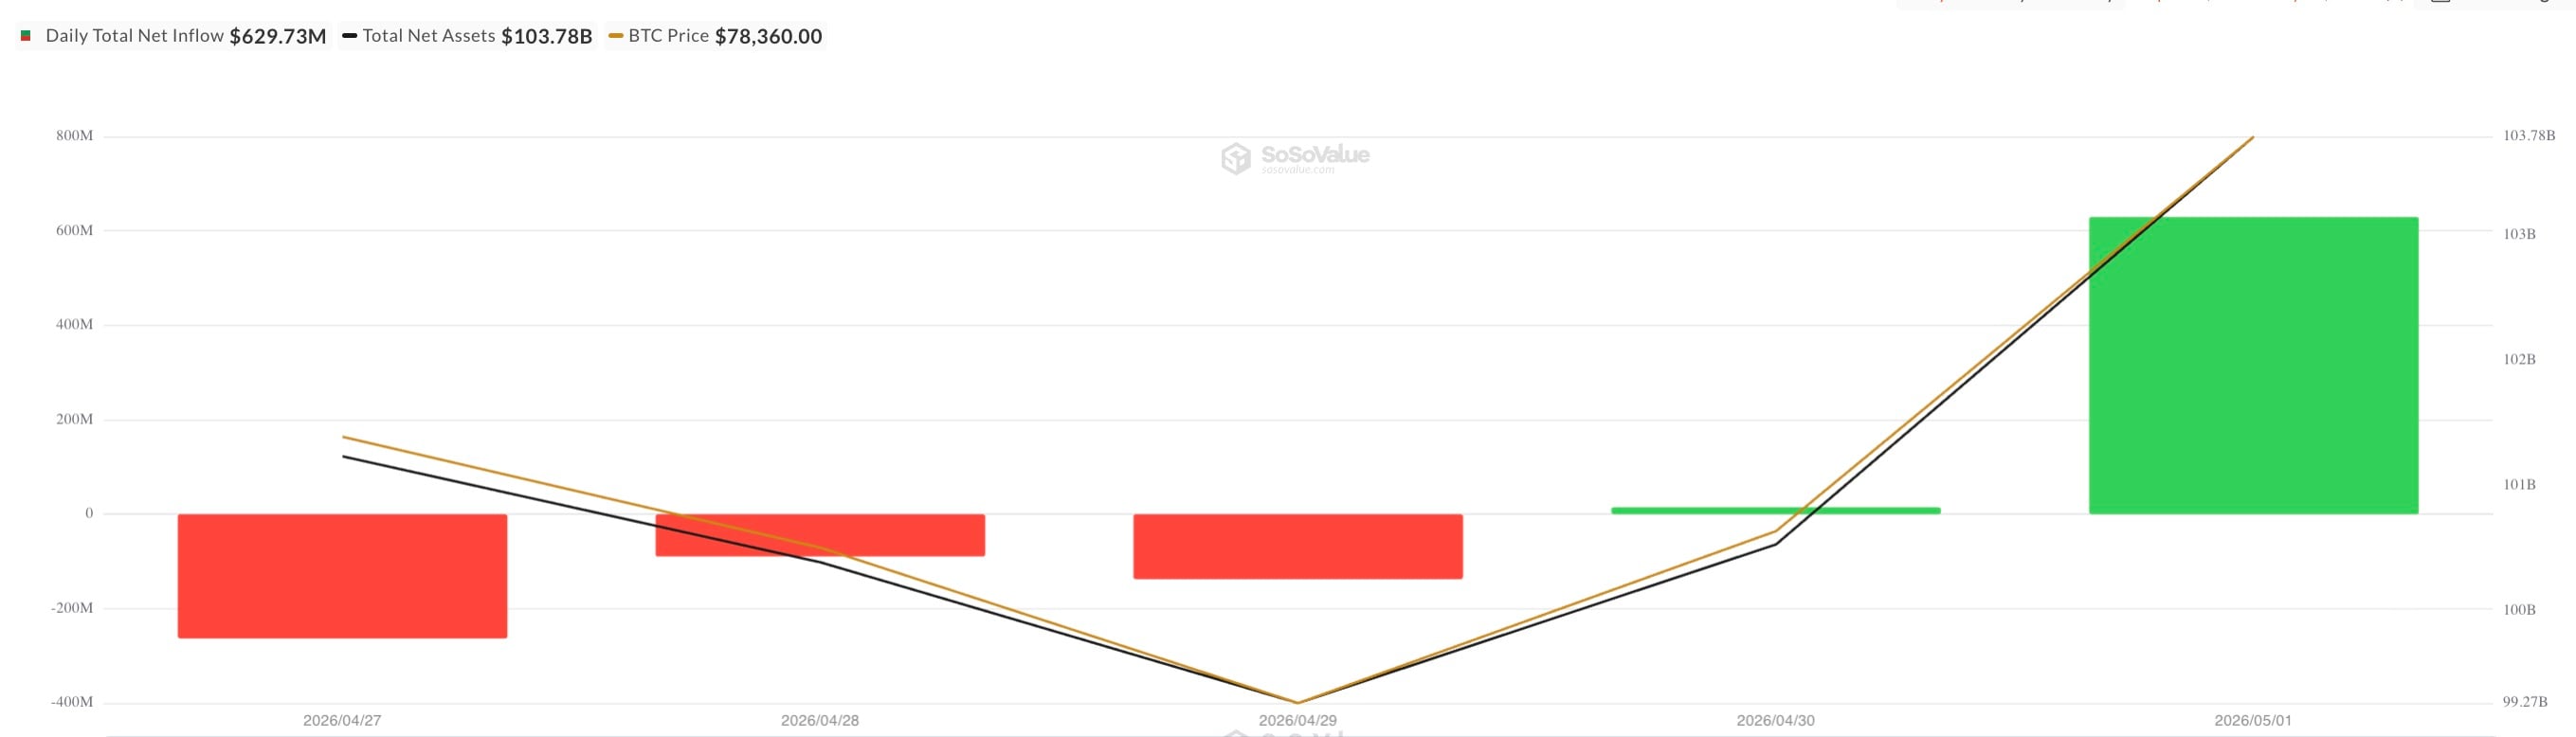
The recent data concerning US spot Bitcoin ETFs sheds light on why bearish pressure was ineffective. Following three days of outflows from April 27 to April 29—during which nearly $500 million was lost—a pivotal change occurred.
On May 1 alone, ETFs recorded net inflows amounting to $629.73 million as reported by SoSoValue. This substantial influx not only compensated for earlier losses but also served as “fuel,” propelling upward movement in candle wicks.
A confirmed technical pattern—a pin bar above the middle Bollinger Band—coupled with these real money inflows increases the likelihood of continued growth since strong demand for Bitcoin appears anchored below $76,500. From a volatility standpoint, maintaining consolidation above this central band paves a path toward reaching an upper channel boundary located at $95,600.
Bears currently lack any solid foundation upon which to build their case against rising prices. The combination of a bullish weekly close alongside renewed aggressive ETF purchases makes it likely that we will see movement towards $95,600 as our primary scenario for May 2026.
FAQ:
- What caused recent fluctuations in Bitcoin’s price?
- The fluctuations were primarily driven by initial bearish pressures due to fund outflows followed by significant ETF inflows that reversed those trends.
- How do Bollinger Bands indicate market trends?
- Bollinger Bands help traders identify potential overbought or oversold conditions based on price movements relative to standard deviations from a moving average line.
- What does a long lower wick signify in candlestick analysis?
- A long lower wick typically indicates strong buying interest after sellers pushed prices down during that trading period but buyers stepped in before closing higher than previous lows.
- If I want more information about investing in ETFs related to cryptocurrencies where should I look?
- You can refer directly through financial news websites or investment platforms specializing in cryptocurrency assets and exchange-traded funds (ETFs).