“`html

As of May 3, 2026, Bitcoin is currently stabilizing beneath a crucial resistance level, facing mixed short-term indicators while benefiting from robust underlying trend support.
Key Insights:
Bitcoin maintains its position at $78K on May 3, 2026, with market data indicating consolidation below the $80K resistance threshold.
TradingView metrics reveal a Relative Strength Index (RSI) of 62 alongside mixed signals that reflect uncertainty within the cryptocurrency markets.
The cryptocurrency is testing the $80K zone; whether it breaks through or faces rejection could dictate a subsequent move ranging from 5% to 10% in upcoming sessions.
Bitcoin Chart Analysis
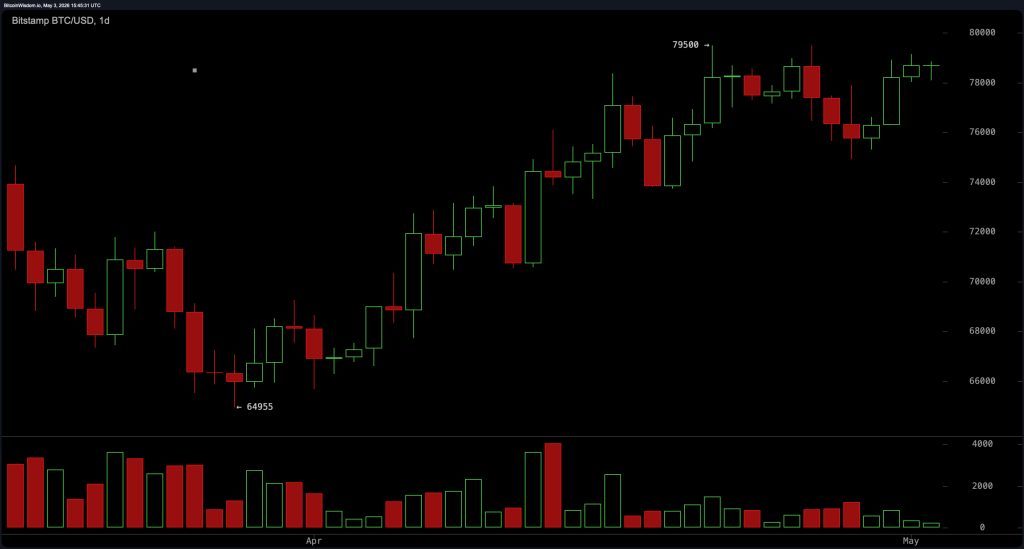
The daily chart for Bitcoin indicates a transitional phase shifting from an earlier macro downtrend towards an emerging recovery pattern. The price action has formed higher lows following a rebound from around $60,000, suggesting an improving market structure. However, current trading between approximately $78,000 and $79,000 places Bitcoin just under a significant supply area ranging from $80,000 to $82,000 where previous distribution occurred.
This positioning implies that although downward momentum has lessened considerably; bullish continuation remains unverified on longer timeframes. The range between $72,000 and $74,000 continues to serve as an essential demand zone that upholds structural integrity. A sustained decline below the critical level of $70K would undermine broader recovery prospects and reintroduce downside risks.
The four-hour chart illustrates that Bitcoin is maintaining a well-defined upward channel established since early April. This sequence of higher highs and higher lows reinforces positive trends; however,momentum appears to be slowing as prices approach overhead resistance levels.
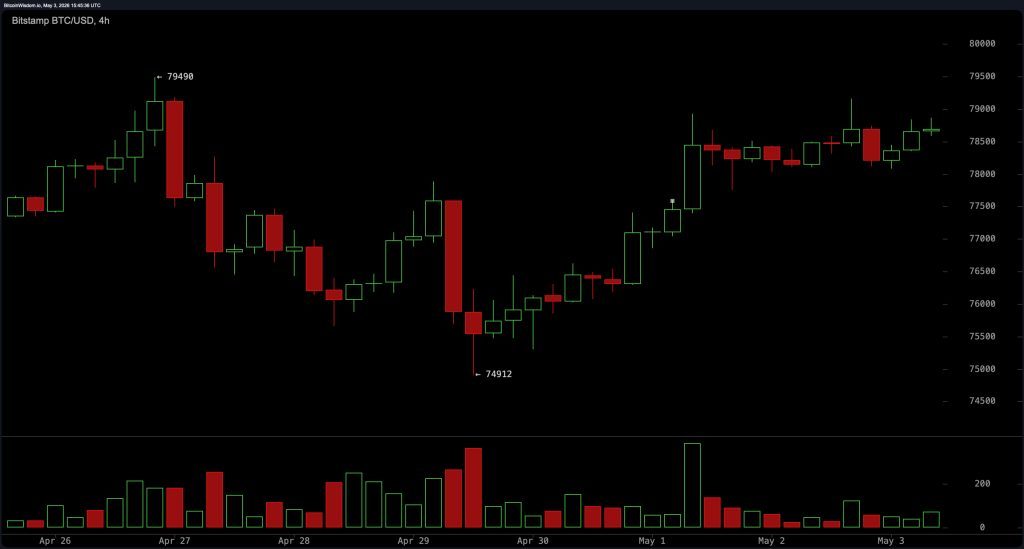
Immediate resistance lies within the range of approximately $79K to $80K,which aligns with the upper boundary of this channel. Clearly defined pullback zones indicate that levels between $75K and $76K represent shallow retracement areas while ranges between $72k and $73k act as deeper structural support zones. This suggests we may be entering into consolidation before making any directional moves ahead。
The one-hour bitcoin chart reveals tight consolidation occurring within boundaries set by prices ranging from around 77k-79k,indicating equilibrium among buyers and sellers in short-term trading activities。The formation showing small incremental higher lows hints at building upward pressure although no decisive breakout has been observed yet。

A movement surpassing $79,500 could likely trigger further momentum expansion;while supports found at levels spanning $76,500 – $77 , are defining lower limits for current trading ranges 。Liquidity seems concentrated within these areas which reinforces expectations surrounding potential volatility increases shortly thereafter 。
Oscillators convey conflicting outlooks reinforcing indecision across markets . The relative strength index ( RSI ) standing firm at sixty-two signifies neutrality ; neither over-bought nor under-sold conditions prevail here . Meanwhile stochastic oscillators also reflect similar sentiments despite nearing elevated thresholds .
Commodity Channel Index ( CCI ) reads one hundred two reflecting negative conditions implying possible short-term overextensions whilst Average Directional Index ( ADX ) shows twenty-five indicating weak trend conviction overall ; Awesome Oscillator prints positive readings hinting toward underlying momentum support still existing throughout these periods 。
Momentum indicators exhibit bearish signals whereas Moving Average Convergence Divergence( MACD) reflects negative values too signaling fading near-term strengths across trades overall ; hence oscillator signals remain balanced aligning perfectly with ongoing consolidations observed through various time frames respectively!
Moving averages tell another story altogether presenting much more constructive perspectives ! Exponential Moving Average( EMA) clusters along shorter durations stay firmly positioned beneath prevailing pricing structures providing solid reinforcement for ongoing trends supporting growth patterns witnessed lately!
The EMA(10) registers seventy-seven thousand four hundred seventy-eight dollars while SMA(10)’s figure stands just above this mark confirming upward alignments here too—similarly both EMA(20)&SMA(20)—twenty-thousand six hundred thirty-two &seventy-six thousand seven hundred thirty-four continue supporting price structures without fail! Even further down curves lie confirmations regarding broader stability seen recently reflected by figures such as EMA fifty placing us back around seventy-four thousand two hundred nineteen along side SMA fifty registering nearly same value correlating closely together confirming layered supportive systems exist right now!
Nevertheless long term resistances remain apparent clearly illustrated by readings derived off EMAs’200 line showing eighty-two thousands one-hundred twenty-seven dollars combined alongside SMAs’200 reaching heights close enough approaching eighty-three thousands six-hundred eighty-six illustrating overhead pressures felt strongly throughout regions lying anywhere inside vicinity stretching beyond eighties becoming crucial inflection points needing attention paid closely moving forward!
In conclusion:as Sunday afternoon unfolds bitcoin navigates technically significant ranges where immediate uncertainties contrast sharply against strong foundational trend supports being established all along thus creating potential scenarios either leading towards breakouts/rejections upcoming soon after!
“`
### FAQ
**Q1: What does it mean when Bitcoin consolidates below resistance?**
A1: Consolidation below resistance indicates indecision among traders about whether to push prices higher or lower.
**Q2: What key levels should I watch for Bitcoin’s next move?**
A2: Key levels include immediate resistances around $79k-$80k and supports near $76.5k-$77k.
**Q3: How do oscillators affect my trading decisions?**
A3: Oscillators provide insights into market momentum; neutral readings suggest caution before making trades.
**Q4: Why are moving averages important in analyzing Bitcoin’s price action?**
A4: Moving averages help identify trends by smoothing out price fluctuations over specific periods.