As of Sunday morning, Bitcoin is priced at $71,587, boasting a market capitalization of $1.43 trillion and a 24-hour trading volume of $28.39 billion. The cryptocurrency has fluctuated within an intraday range from $71,484 to $73,720. This recent price decline was triggered by remarks from U.S. Vice President JD Vance regarding the unsuccessful peace negotiations between the United States and Iran in conjunction with talks involving Pakistan. Overall technical indicators appear neutral as short-term strength meets persistent resistance on higher timeframes in a market that remains uncertain about its next direction.
Key Insights:
Bitcoin is currently valued at $71,587 as of April 12, 2026, at 7:30 AM Eastern Time; the sideways movement indicates weak trend momentum.
According to TradingView data, the RSI stands at 56 while ADX reads 16; this neutral momentum suggests limited conviction for breakouts.
The cryptocurrency encounters resistance around the $73.5K mark; breaking above $74K or dropping below $70K will dictate its next trajectory.
Bitcoin Chart Analysis
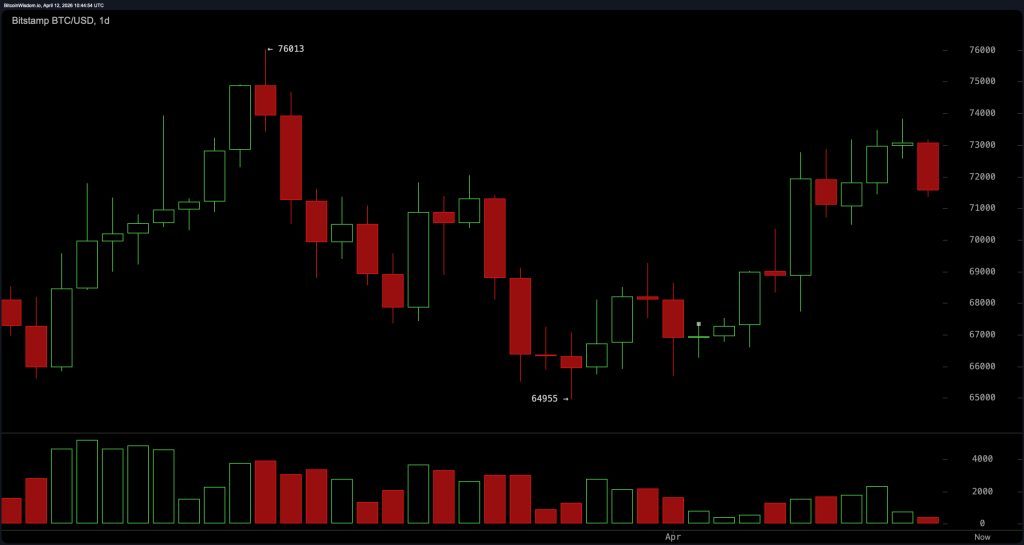
On daily charts, Bitcoin continues to trade within a clearly defined range between roughly $65,000 and $76,000 with current prices hovering near the upper limit around $72-73K—testing resistance rather than forming a solid breakout pattern.
The upward momentum has notably diminished after bouncing back from the low of around $65K indicating that bullish energy may be waning. This situation places Bitcoin in an unfavorable position where potential gains are capped nearby while significant support lies several thousand dollars lower down.
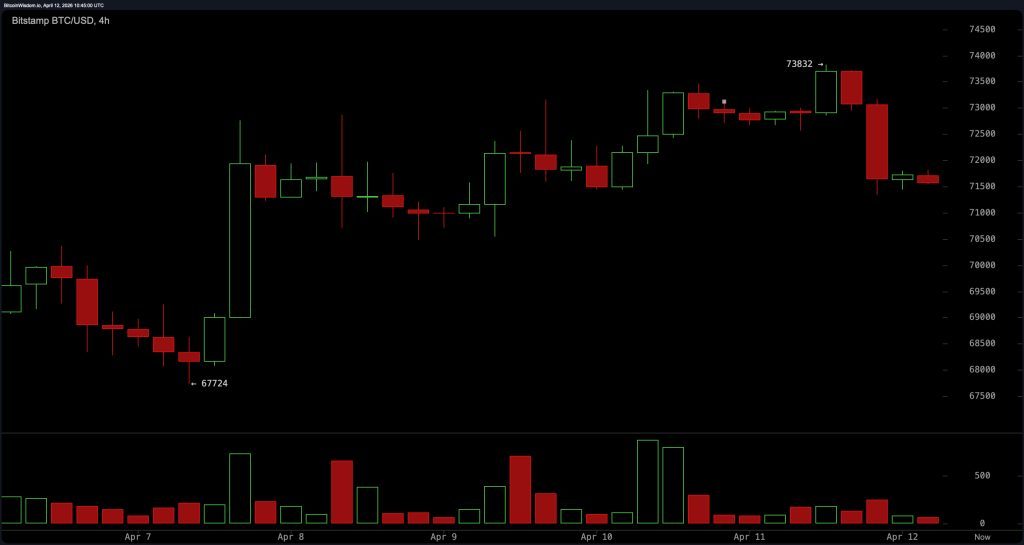
The four-hour chart presents a more cautious outlook marked by sharp rejection near the price point of approximately $73,720 which resulted in a strong bearish candle formation. Since then price dynamics have transitioned into creating lower highs indicating emerging short-term weakness within this market environment. Resistance levels are now distinctly set between $72,500 and $73,500 while support ranges from $70,500 down to $71,000; breaching below $70,000 could amplify downward pressure further complicating recovery efforts for Bitcoin which appears trapped in corrective territory instead of gaining directional strength consistently.
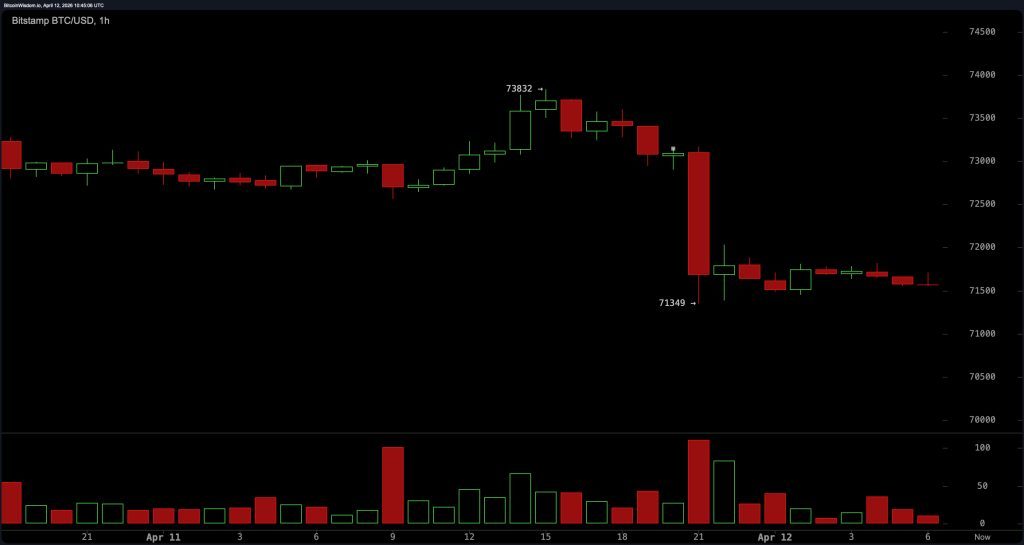
In hourly analyses ,Bitcoin has entered into tight consolidation around (71text{ }500) following an abrupt decline .The subsequent rebound observed lacks vigor reflecting minimal buyer engagement .Intraday resistances can be found ranging between (72text{ }000 )and (72text{ }500 ),while supports lie close to (71text{ }300 )extending downwards towards (70text{ }500 ).This range-bound activity suggests stability but not one that fosters confidence—more akin to stalemate rather than preparation for decisive action ahead .
Oscillators further emphasize prevailing indecision across broader metrics ; overall summaries remain neutral with relative strength index ( RSI ) reading fifty-six indicating balanced conditions whereas stochastic readings suggest overextension territory reflected by eighty-six points achieved during analysis period .
Commodity channel index ( CCI ) registers ninety-four remaining elevated yet neutral alongside average directional index ( ADX ) noted sixteen confirming weak trend characteristics present throughout current landscape.Meanwhile awesome oscillator maintains neutrality measuring two thousand three hundred fifty-one whilst momentum levels indicate diminishing force reflected through ten-point metric showing four thousand six hundred seventy-nine units recorded so far.The moving average convergence divergence ( MACD )( twelve , twenty-six ) value standing seven hundred eight signals rare constructive insight although it appears somewhat isolated amidst mixed signals overall.
Moving averages summary also lands firmly entrenched within neutrality zone however details reveal stark division.Short term indicators show promise supported chiefly by exponential moving average( EMA )( ten ) priced seventy-thousand nine hundred twenty-two dollars along simple moving average(SMA)(ten)dipping sixty-eight-thousand five hundred forty-six beneath existing values paired respectively against EMA(20)at seventy-thousand one-hundred-two dollars & SMA(20)at sixty-nine-thousand one-hundred-eighty-six respectively.Even longer terms such as EMA(30)(sixty-nine-five-three)dips under valuation trends reinforced subsequently again due diligence applies where EMAs rise up toward heights pushing boundaries beyond reach still displaying potential growth prospects yet overall bearish sentiments loom large casting shadows upon bullish aspirations thus making investors wary about future prospects ahead.
Bullish Perspective:
If bitcoin successfully reclaims territory above thirty-seven thousand five-hundred-$to-forty-four-k region this would invalidate prior sequences established leading downward thrusts thus reinstating upward movements across shorter frames accompanied closely together yielding supportive signs emanating forth based upon respective parameters observed previously including encouraging performance witnessed through MACD analytics hence allowing markets potentially shift sentiment rapidly paving pathways toward retesting previous peaks situated closer approaching heights nearing seventy-five-k regions should such developments unfold accordingly signaling readiness once again restoring faith back into community fostering optimism throughout entire ecosystem alike!
Bearish Perspective:
A failure here would result invalidation occurring if unable hold ground falling beneath critical thresholds positioned roughly targeting ranges surrounding high seventies therefore confirming increased pressures bearing heavily downwards consequently leading traders exploring avenues likely trending towards sub-sixty-ninth markers ultimately driving selling actions forward compounding losses experienced earlier forcing participants reconsider their strategies entirely given lackluster performances exhibited previously coupled alongside overhead resistances acting decisively hindering any chance recovery taking place leaving bears fully emboldened continuing push-down pressure relentlessly without hesitation whatsoever!