
As of March 4, 2026, at 8:30 a.m. EST, Bitcoin was valued at $71,559. The cryptocurrency boasts a market cap of $1.43 trillion and recorded a trading volume of $59.53 billion over the past day. During this period, its price fluctuated between $66,336 and $71,805 as it approached a significant resistance level near the $72,000 mark after bouncing back from support around the $60,000 area.
Bitcoin Price Analysis
The daily chart indicates that Bitcoin is stabilizing following a sharp decline from approximately the $90,000 range down to critical support levels around $59,000 to $60,000. Since this drop-off occurred, the market has formed an extensive consolidation zone while gradually regaining higher price points.
Currently positioned near the upper limits of this range between $71K and $72K suggests that traders are transitioning from panic selling to cautious recovery—an all-too-familiar phase where they assess whether momentum can maintain itself above resistance rather than just touching it briefly.
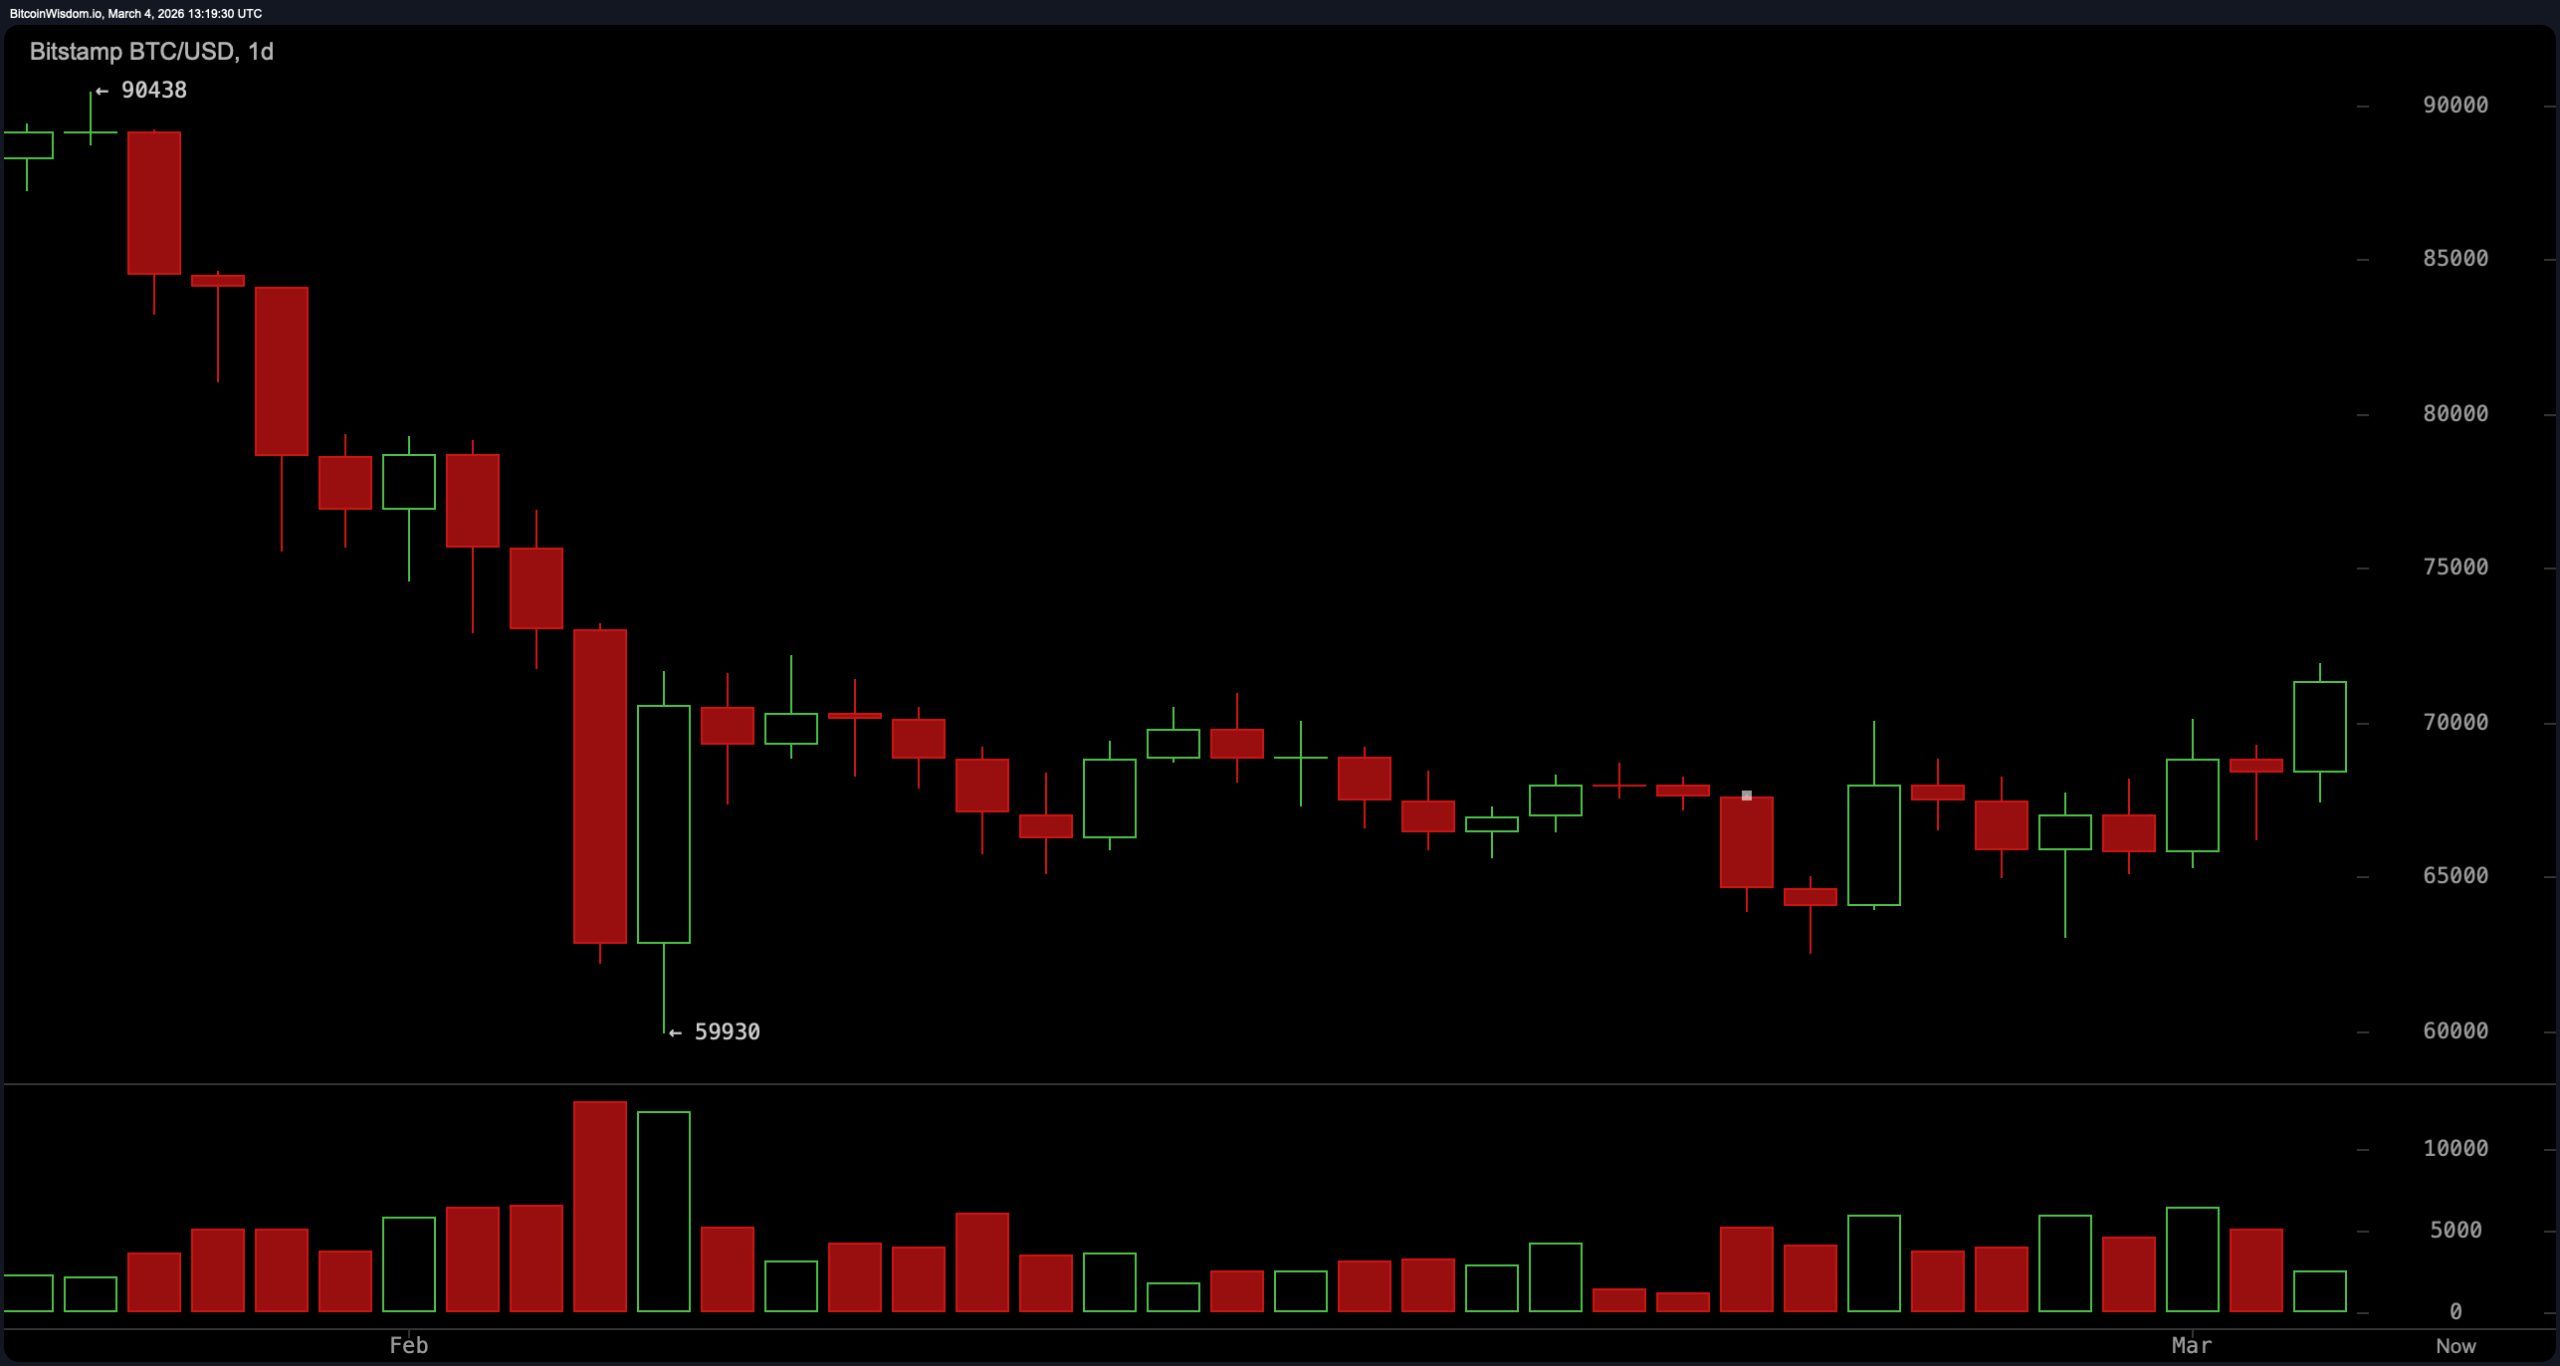
$BTC/USD one-day chart via Bitstamp on March 4th.
The four-hour chart provides clearer insights into shifting momentum dynamics. Since rebounding from about $67K upwards towards an intraday high close to $71K before entering brief consolidation phases—a pattern typically indicative of trend continuation rather than exhaustion—Bitcoin has been establishing higher highs and lows consistently during this period. Immediate resistance lies within $71k-$72k while short-term support hovers around $69k with stronger structural backing appearing closer to $67k; essentially depicting how markets behave like runners catching their breath just shy of crossing finish lines—not in freefall mode.
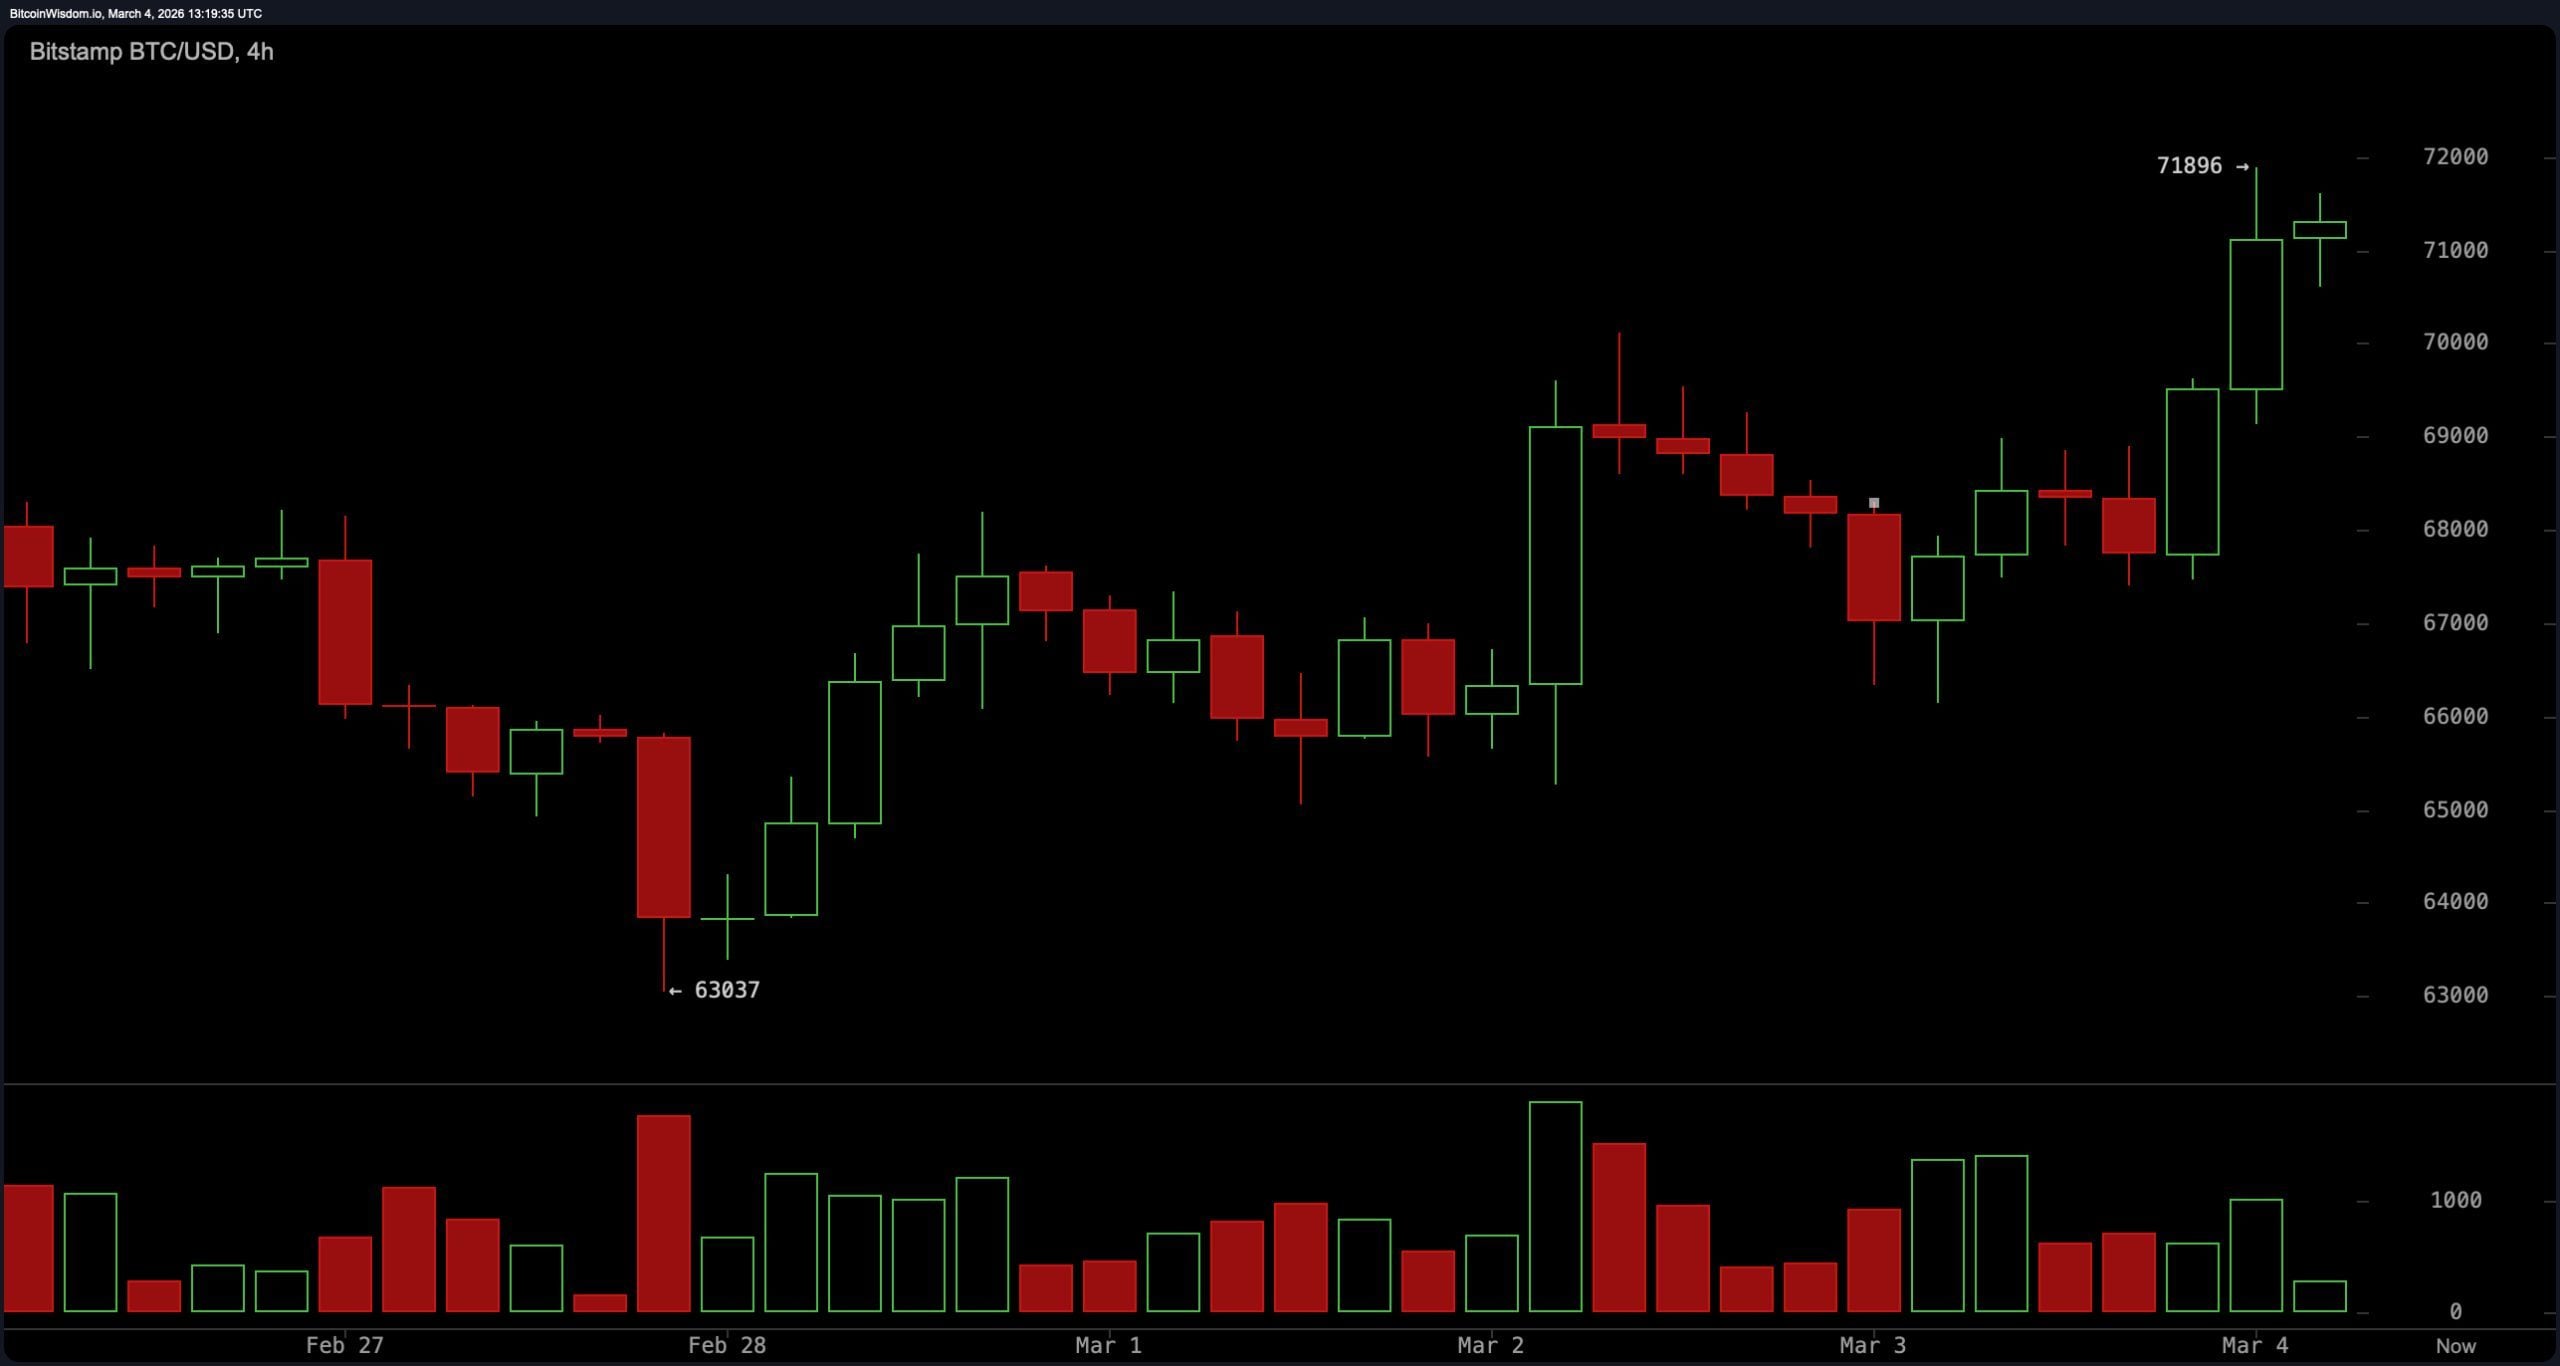
$BTC/USD four-hour chart via Bitstamp on March 4th.
A more granular view provided by one-hour charts echoes similar trends observed previously; Bitcoin experienced rapid upward movement followed by compression into tight ranges beneath key resistances—a common precursor signaling directional pressure build-up ahead of potential breakout attempts! While short-term momentum remains positive overall—the market hasn’t yet demonstrated decisive expansion needed for overcoming that crucial barrier at ( text{$}72text{K} ). Until such time arrives when it breaks convincingly through there—traders find themselves observing coiled springs instead of confirmed breakouts!
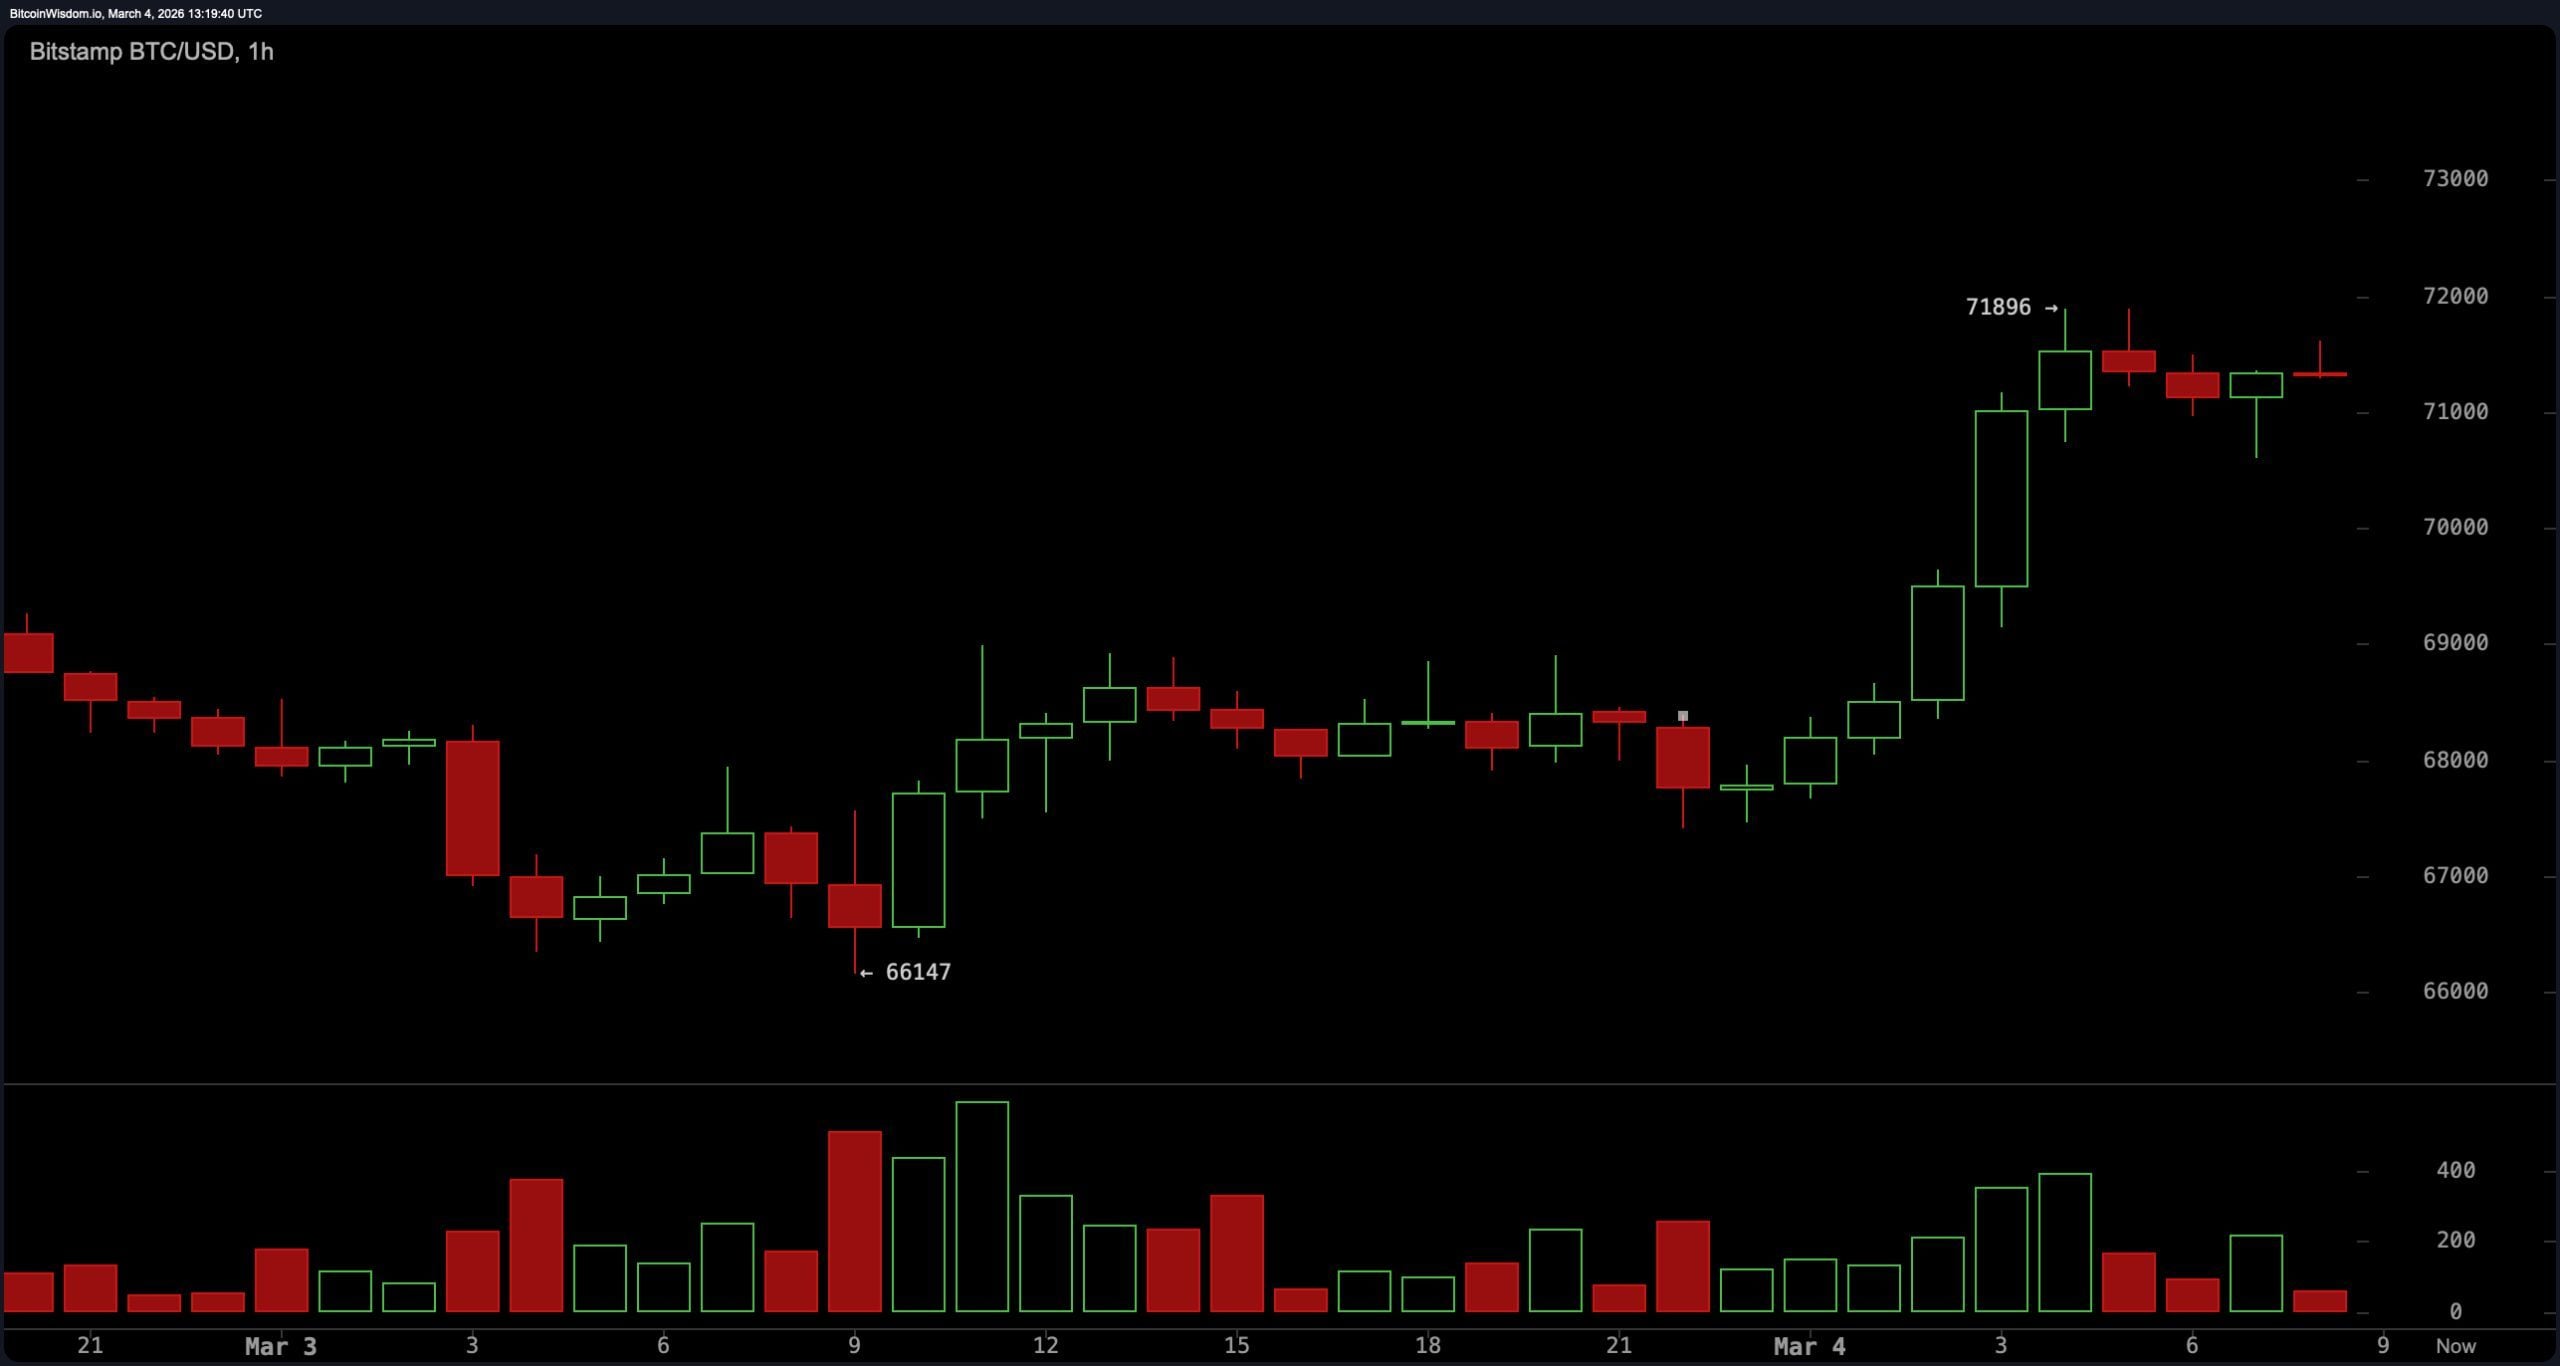
$BTC / USD one-hour chart via Bitstamp on March fourth.
Oscillator readings present mixed signals but generally indicate stabilization across various indicators examined here today! The relative strength index (RSI) currently rests comfortably at fifty-three suggesting neutral conditions without signs pointing toward overbought territory; stochastic oscillators report eighty-four indicating neutrality too though nearing upper bounds whilst commodity channel indices (CCI) print out numbers reaching one hundred sixty-seven hinting elevated yet still balanced activity levels overall!
The average directional index (ADX) shows forty-four reflecting strengthening trends emerging lately amidst current fluctuations occurring within these markets lately! Meanwhile awesome oscillators remain negative posting -2054 whereas momentum registers positively standing tall at three thousand seven hundred thirty-one along with moving average convergence divergence (MACD) showing -1718 too—all suggesting constructive leanings amongst those indicators although none screaming certainty outright either way!
Examining moving averages reveals additional nuances worth noting here as well! Short-term signals exhibit positivity—with exponential moving averages(EMA10) clocking in around sixty-eight thousand fifty-seven dollars alongside simple moving averages(SMA10) tracking closely behind them averaging sixty-seven thousand one hundred twenty-seven dollars both pointing upwards reinforcing bullish sentiment seen recently throughout these charts analyzed so far today!. EMA20 stands firm also hovering above seventy-one thousand five hundred thirty-five while SMA20 aligns nicely resting slightly lower hitting seventy-thousand six-hundred ninety-eight continuing uptrend witnessed earlier too!. Longer term measures however reflect aftermaths left behind due corrections made prior still evident especially given how EMA50 stays perched high above prices reaching seventy-four-thousand three-hundred fifty-nine meanwhile SMA50 lingers further away settling even higher nearer seventy-six-thousand three-hundred thirty-four thus reminding everyone who initially knocked markets down earlier times gone past!
Bullish Perspective:
The structure displayed across both hourly & four hourly charts indicates increasing upside pressures manifesting themselves as prices consolidate right below critical resistances ranging anywhere between ( text{$}71800-$72000). Short term EMAs—including EMA10 priced roughly @68,057 alongside EMA20 averaging out @68,705 plus lastly EMA30 closing off strong nearing70,503—all continue supporting movements occurring underneath current pricing levels whilst oscillators like Momentum + MACD remain leaning positively towards growth opportunities ahead if we secure decisive moves breaking through aforementioned barriers eventually leading us potentially towards targets lying somewhere closer approximating ranges stretching upwards beyond75,000-78,text{ K } regions thereafter .
Bearish Perspective:
Despite recent rebounds taking place lately , bitcoin continues trading below several higher timeframe Moving Averages which reflect previous corrections endured not long ago . Exponential Moving Average(EMA50 )currently rests firmly @74 ,359 whereas Simple Moving Average(SMA50 )stands even taller registering approximately76 ,334 ! Furthermore longer term metrics show evidence regarding residual downward pressures stemming directly originating back preceding events affecting our current standings such as witnessing first hand effects caused by earlier volatility periods unfolding accordingly . Oscillators appear mostly neutral presently therefore failing clear established thresholds set forth within ( text{$}71800-$72000); should any breakdown occur falling beneath nearby supports resting round69, text{ K } particularly emphasizing those surrounding66, text{ K }, then expect shifts returning bearish sentiments pushing us downward targeting potential supports revisiting63-60,k zones once again thereafter !
Frequently Asked Questions 🔎
What is bitcoin’s price on March 4th?
As per reports received recently regarding trades ongoing now suggest values floating close enough approximating73 ,559 remaining valid throughout day’s transactions conducted therein !
What resistance level is bitcoin testing right now?
Presently pressing against key resistances hovering somewhere amid(71780-72000), following rebounds traced back since encountering difficulties stemming originally arising outfrom65-K territories encountered last week leading up until now onwards indeed !
What do bitcoin’s technical indicators show?
The general consensus among many analysts suggests oscillations trending neutrally paired alongside short terms MA exhibiting signs indicating upward movements steadily gaining traction underneath prevailing pricing structures being observed currently today across board collectively speaking thus far indeed.!
What are key support levels for bitcoin ?
Immediate supports reside closely situated nearby69,K along with stronger ones appearing further down ranging roughly about67-K heading southwards possibly trailing finally rounding up concluding ultimately circling63-60,k territories awaiting next steps taken thereafter perhaps depending upon future developments forthcoming expected soon afterwards eventually arriving sooner or later hopefully approaching resolution points identified henceforth ….