Bitcoin remains confined within a narrow trading band, as a liquidation heatmap reveals significant liquidity concentrated between $69,000 and $70,000, with another cluster forming near $62,000. On the daily timeframe, Bitcoin (BTC) has demonstrated a breakout followed by a retest from a contracting triangle pattern. The next critical resistance to overcome is identified at the $70,000 mark.
Key Liquidity Zones Identified Around $69K and $62K in Bitcoin Market
An insightful Bitcoin liquidation heatmap shared by analyst Columbus on platform X illustrates BTC’s price action trapped within a tight range while liquidity pools accumulate just above and below this zone. The four-hour BTCUSD chart integrates price movements with the MMT heatmap that pinpoints potential areas where substantial liquidations could occur.
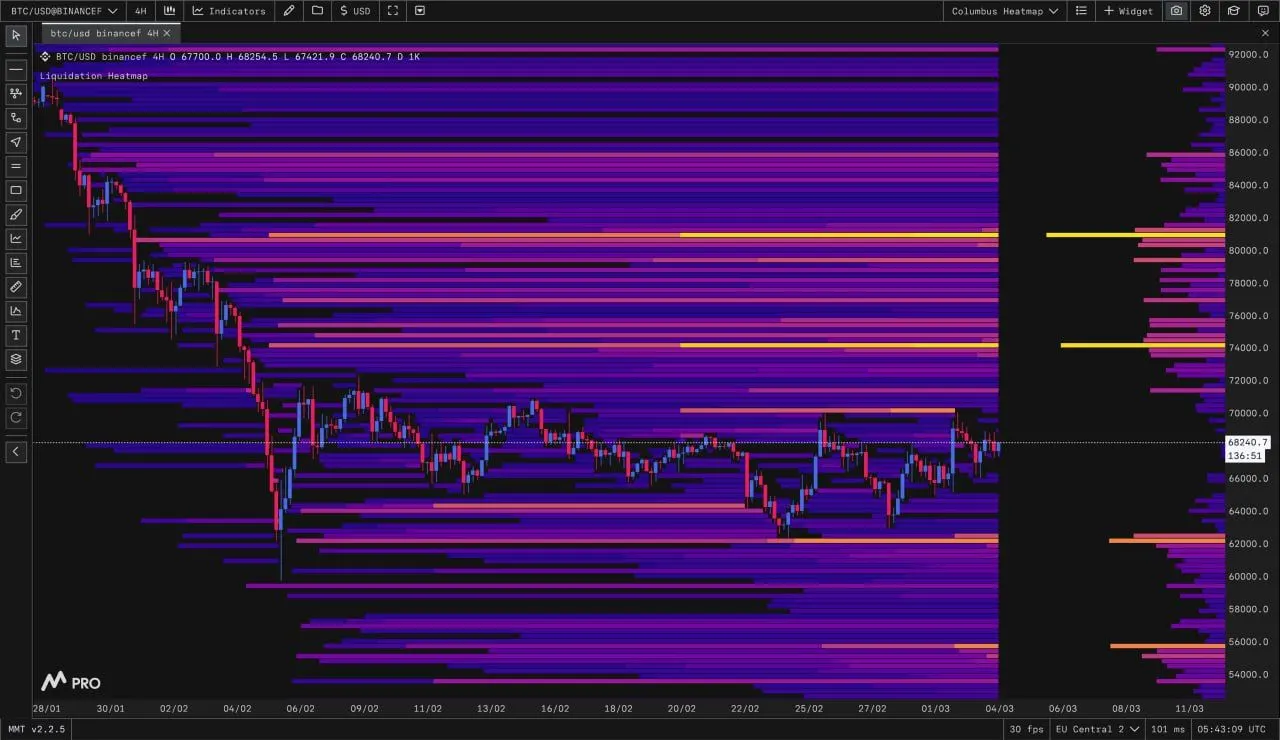
Bitcoin Liquidation Heatmap Range Structure. Source: Columbus
The visualization highlights that liquidity is heavily clustered around the $69,000 to $70,000 range. These zones appear brighter on the heatmap indicating elevated chances of mass liquidations if prices push upward into these levels. According to Columbus’s analysis, this area might provoke a short squeeze as traders holding short positions may be compelled to exit their trades.
Additionally, there is an emerging pocket of liquidity near the $62,000 level beneath Bitcoin’s current consolidation midpoint. Should prices break down from this middle section and downward momentum intensifies, this lower cluster could attract price movement toward it.
The recent candlestick patterns depict sideways movement within this range rather than any decisive breakout directionally. Each dip has encountered buying support while rallies have stalled against overhead resistance lines resulting in ongoing compression between upper and lower liquidity zones.
The analyst suggests that significant directional momentum will likely develop once BTC approaches either of these key liquidity clusters—breaking above the upper band may trigger accelerated moves fueled by short-covering liquidations whereas falling below mid-range shifts focus toward support near 62k.
Daily Chart Reveals Breakout Followed By Retest From Triangle Formation
A daily chart posted by SuperBitcoinBro on X shows Bitcoin breaking out from a tightening triangular consolidation before retesting its former resistance line now turned support. This sequence labeled as “breakout” followed by “retest” indicates potential continuation if price sustains above this reclaimed trendline.
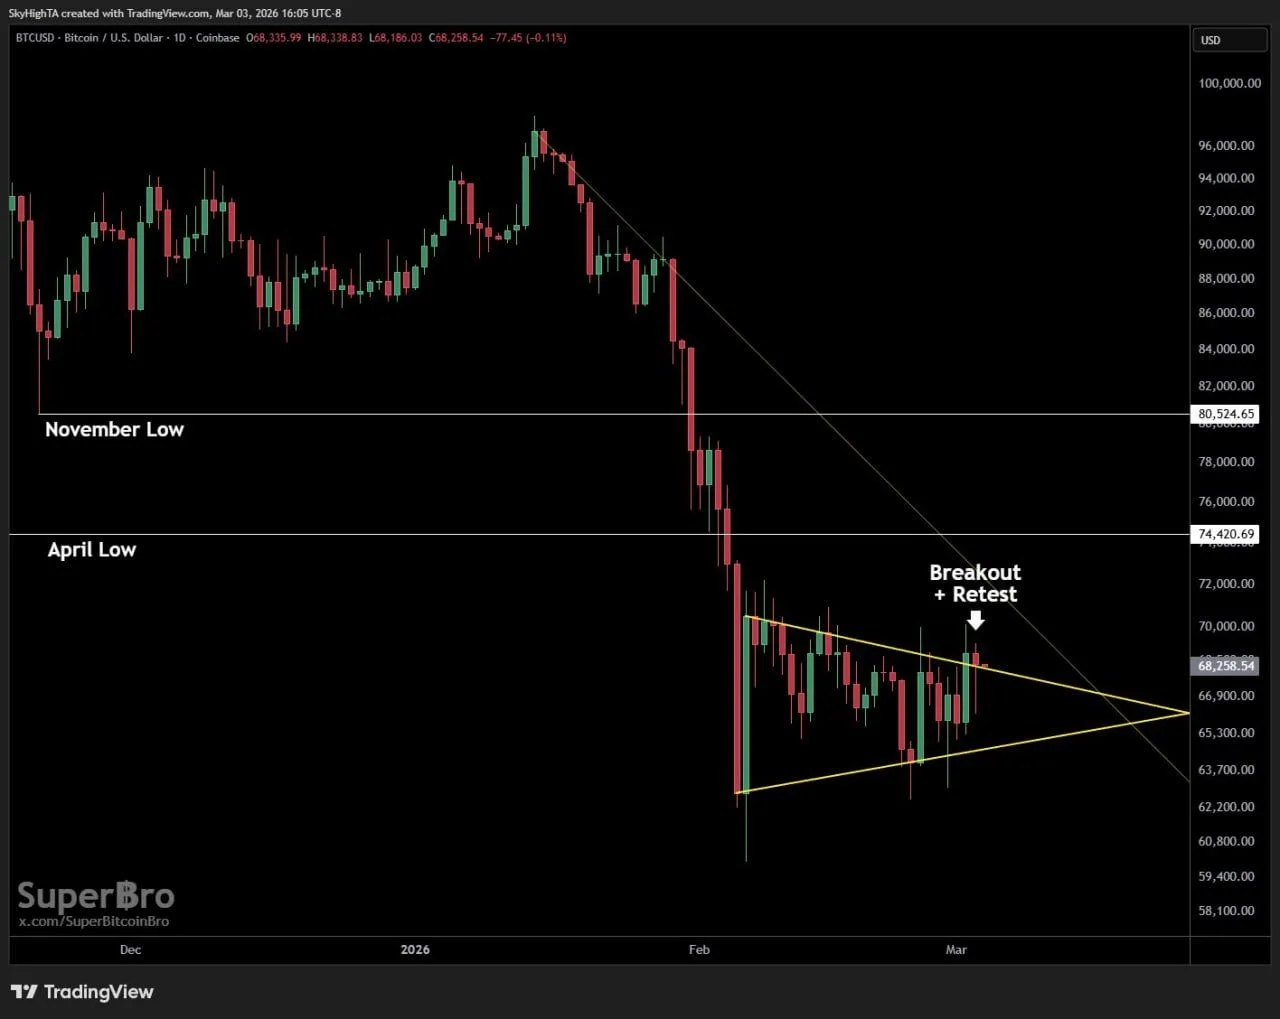
Bitcoin Daily Triangle Breakout and Retest Chart Source: SuperBitcoinBro
Prior to forming the triangle pattern itself was marked by sharp declines pushing BTC below two important reference points—the November low around $80,524 and April low near $74,421.
This drop led candles into compressing inside a wedge shape characterized by descending highs meeting ascending lows converging towards an apex.
The retest phase occurs after BTC broke through its upper triangle boundary then revisited it for confirmation.
This analysis identifies $70,000 if surpassed, a crucial level signaling further bullish momentum, taking over from what now acts as immediate structural support along $BTC’s complex market dynamics.