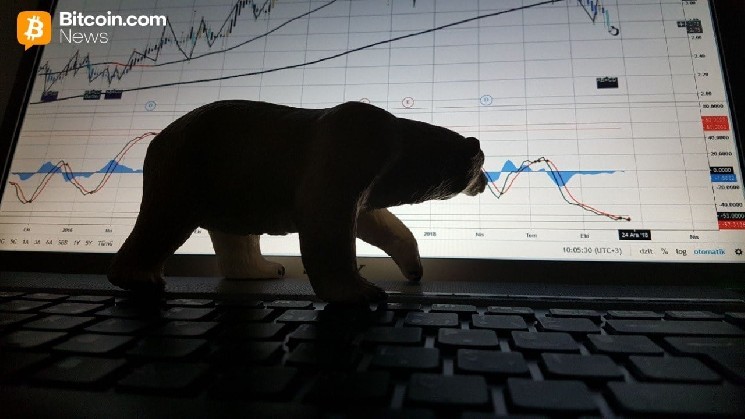
The surge in Bitcoin’s value has come to a halt, as the cryptocurrency fell from its peak of over $69,000 to around $67,000. This downturn resulted in liquidations exceeding $470 million and erased approximately $40 billion from its market capitalization.
Market Capitalization Declines Amid Liquidation Events
On February 26, Bitcoin’s brief rally encountered significant resistance. After breezing past the crucial threshold of $69,000, it faced challenges maintaining that momentum. Market analysis indicates a sharp decline to approximately $66,511 before a quick recovery brought it back near the $67,000 mark. This cooling phase sharply contrasts with the previous day’s activity when Bitstamp data showed an upward trend towards the psychological barrier of $70,000.
This drop led to an approximate loss of $40 billion in Bitcoin’s market cap within just one day—plummeting from about $1.38 trillion down to roughly $1.34 trillion. The overall cryptocurrency market also felt this impact; it dipped by 2.4%, bringing its total valuation down to around $2.38 trillion as volatility swept through markets and caused more than half a billion dollars in leveraged positions to be liquidated within 24 hours.
Bitcoin’s nearly 2 percent decline mirrored movements in equity markets experiencing their own downturns; by midday Eastern Time on that same day, the Nasdaq Composite index had dropped over 300 points. Even amidst Nvidia’s impressive earnings report—which significantly exceeded Wall Street predictions—investors remained cautious and disillusioned due to concerns regarding massive capital investments required by AI companies leading into broader sell-offs affecting both Dow Jones Industrial Average and S&P 500 indices.
The primary trigger for this global risk-averse sentiment appears linked with fluctuating discussions between the U.S.and Iran regarding nuclear enrichment activities; reports on social media indicated Iran may have dismissed U.S.requests for relocating enriched uranium outside its borders—a claim yet unverified but if accurate could escalate tensions toward potential military conflict disrupting energy markets and global supply chains further complicating price stability.
Analysts at Bitunix suggest that such geopolitical instability is creating divergent paths for investors—while traditional safe-haven assets may benefit from increased demand during crises like these high-growth assets find themselves under pressure.
“Should there be direct military engagement between the U.S.and Iran,” analysts project “gold prices could see an increase close to 15 percent within two weeks driven primarily by safe-haven demand targeting levels between $5,500 and $5,800 per ounce.”
In contrast however riskier investments such as bitcoin along with technology stocks are likely facing compounded pressures due both liquidity constraints tightening alongside strengthening dollar values which could lead them back towards retesting critical support levels ranging between $64k–$65k should tensions persist according Bitunix forecasts advising investors retreating temporarily sidelines until clarity emerges once again.”
Frequently Asked Questions ❓
What is causing today’s drop in bitcoin prices? The price fell towards $66k largely influenced by escalating geopolitical issues surrounding U.S.-Iran relations fostering “risk-off” attitudes across international financial landscapes.
How have tech stocks impacted cryptocurrencies like bitcoin? As investors shifted focus away from high-growth sectors amid significant declines (over three hundred points) seen within Nasdaq index itself even strong performances (like those reported recently out Nvidia) failed prevent losses experienced throughout crypto sphere.
What implications do rising tensions between America & Iran hold for global finance stability? Increased apprehensions surrounding possible military confrontations have exacerbated fluctuations related energy pricing while raising inflationary worries thereby putting pressure upon equities/digital asset classes alike.
Which key support levels should traders monitor during current volatility phases? Analysts recommend keeping watchful eyes on critical liquidity zones situated around $64k–65K thresholds if ongoing marketplace strains persist further testing anticipated soon thereafter.”