In the past hour, Bitcoin’s price has hovered between $89,884 and $90,136 per coin, boasting a market capitalization of approximately $1.79 trillion. Over the last 24 hours, trading volume surged to an impressive $47.40 billion as prices fluctuated from a low of $87,315 to a high near $89,963. Although momentum appears somewhat hesitant at present, technical charts imply that Bitcoin is adopting a strategic stance—measured and patient—before making its next decisive move.
Bitcoin Price Analysis
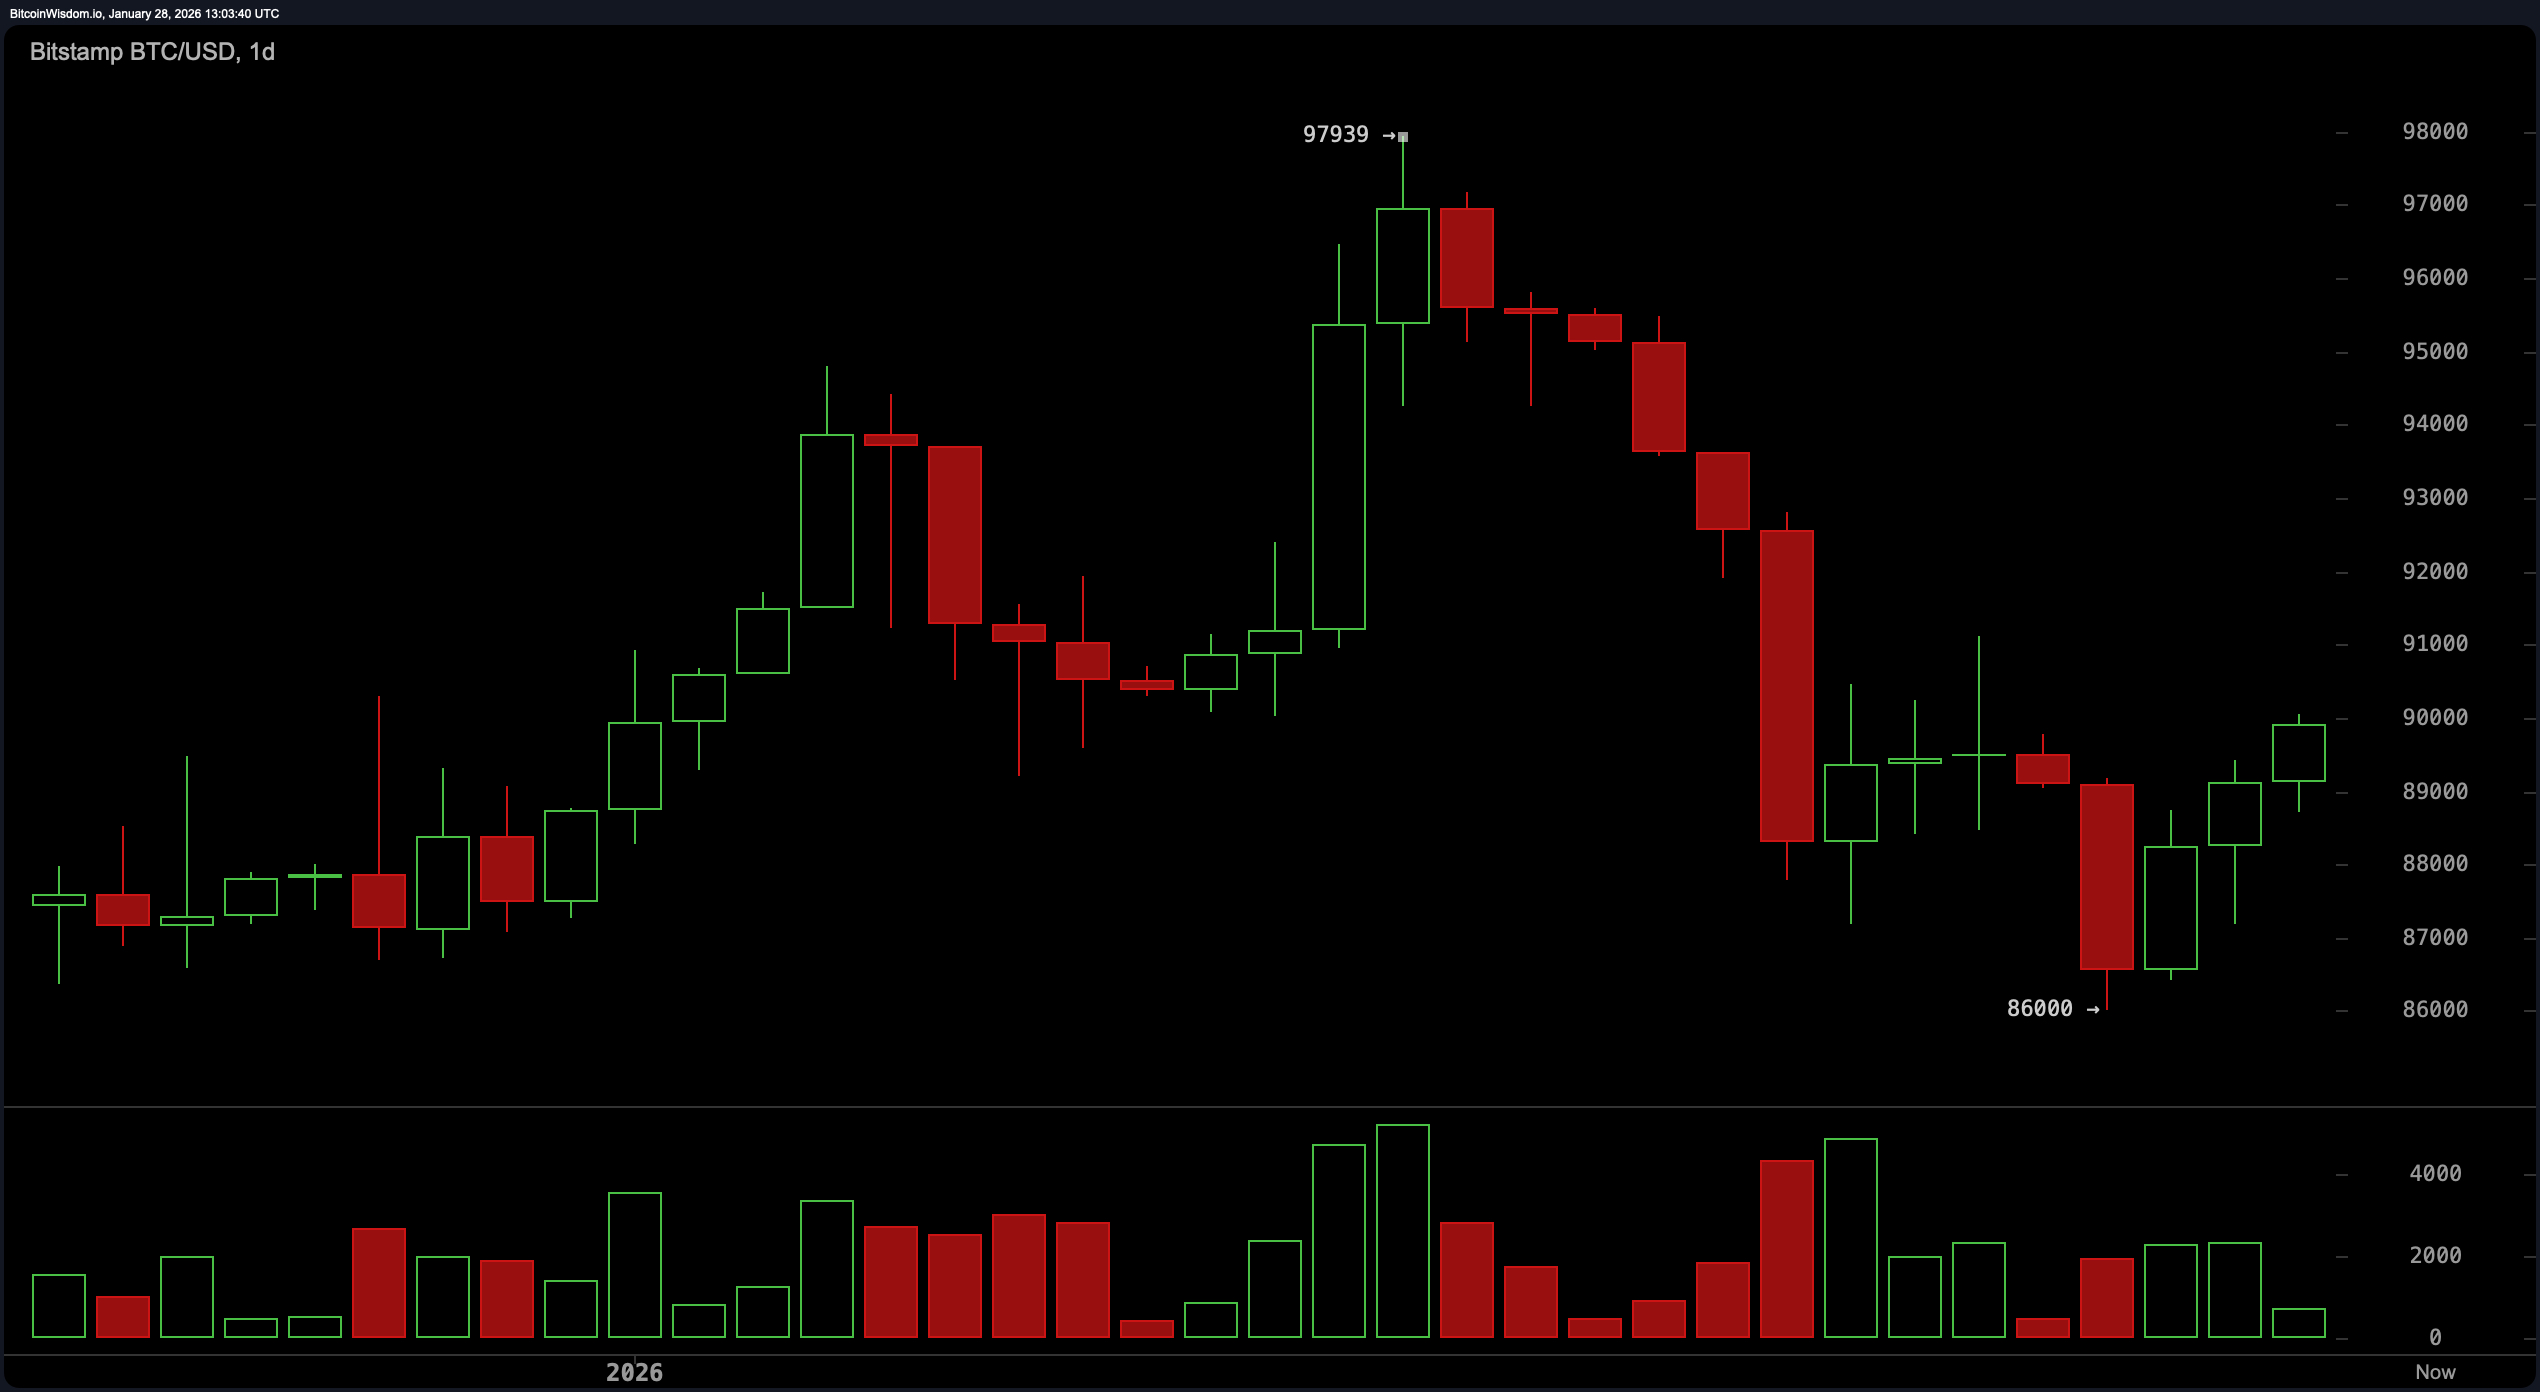
The daily chart reveals signs of recovery amid volatility. After reaching a peak close to $97,939 recently, Bitcoin experienced a sharp decline down to around $86,000 but managed to rebound with enough strength to attract attention again. The sell-off was characterized by heavy volume capitulation; however, subsequent lighter-volume green candles suggest early signs of bullish interest returning.
Support levels near the $86,000 mark remain robust for now and hint at the formation of a tentative bottom. Conversely, resistance zones between roughly $91,000 and $93,000 present challenges where traders should carefully monitor candle formations alongside any divergence in trading volumes around these critical points.
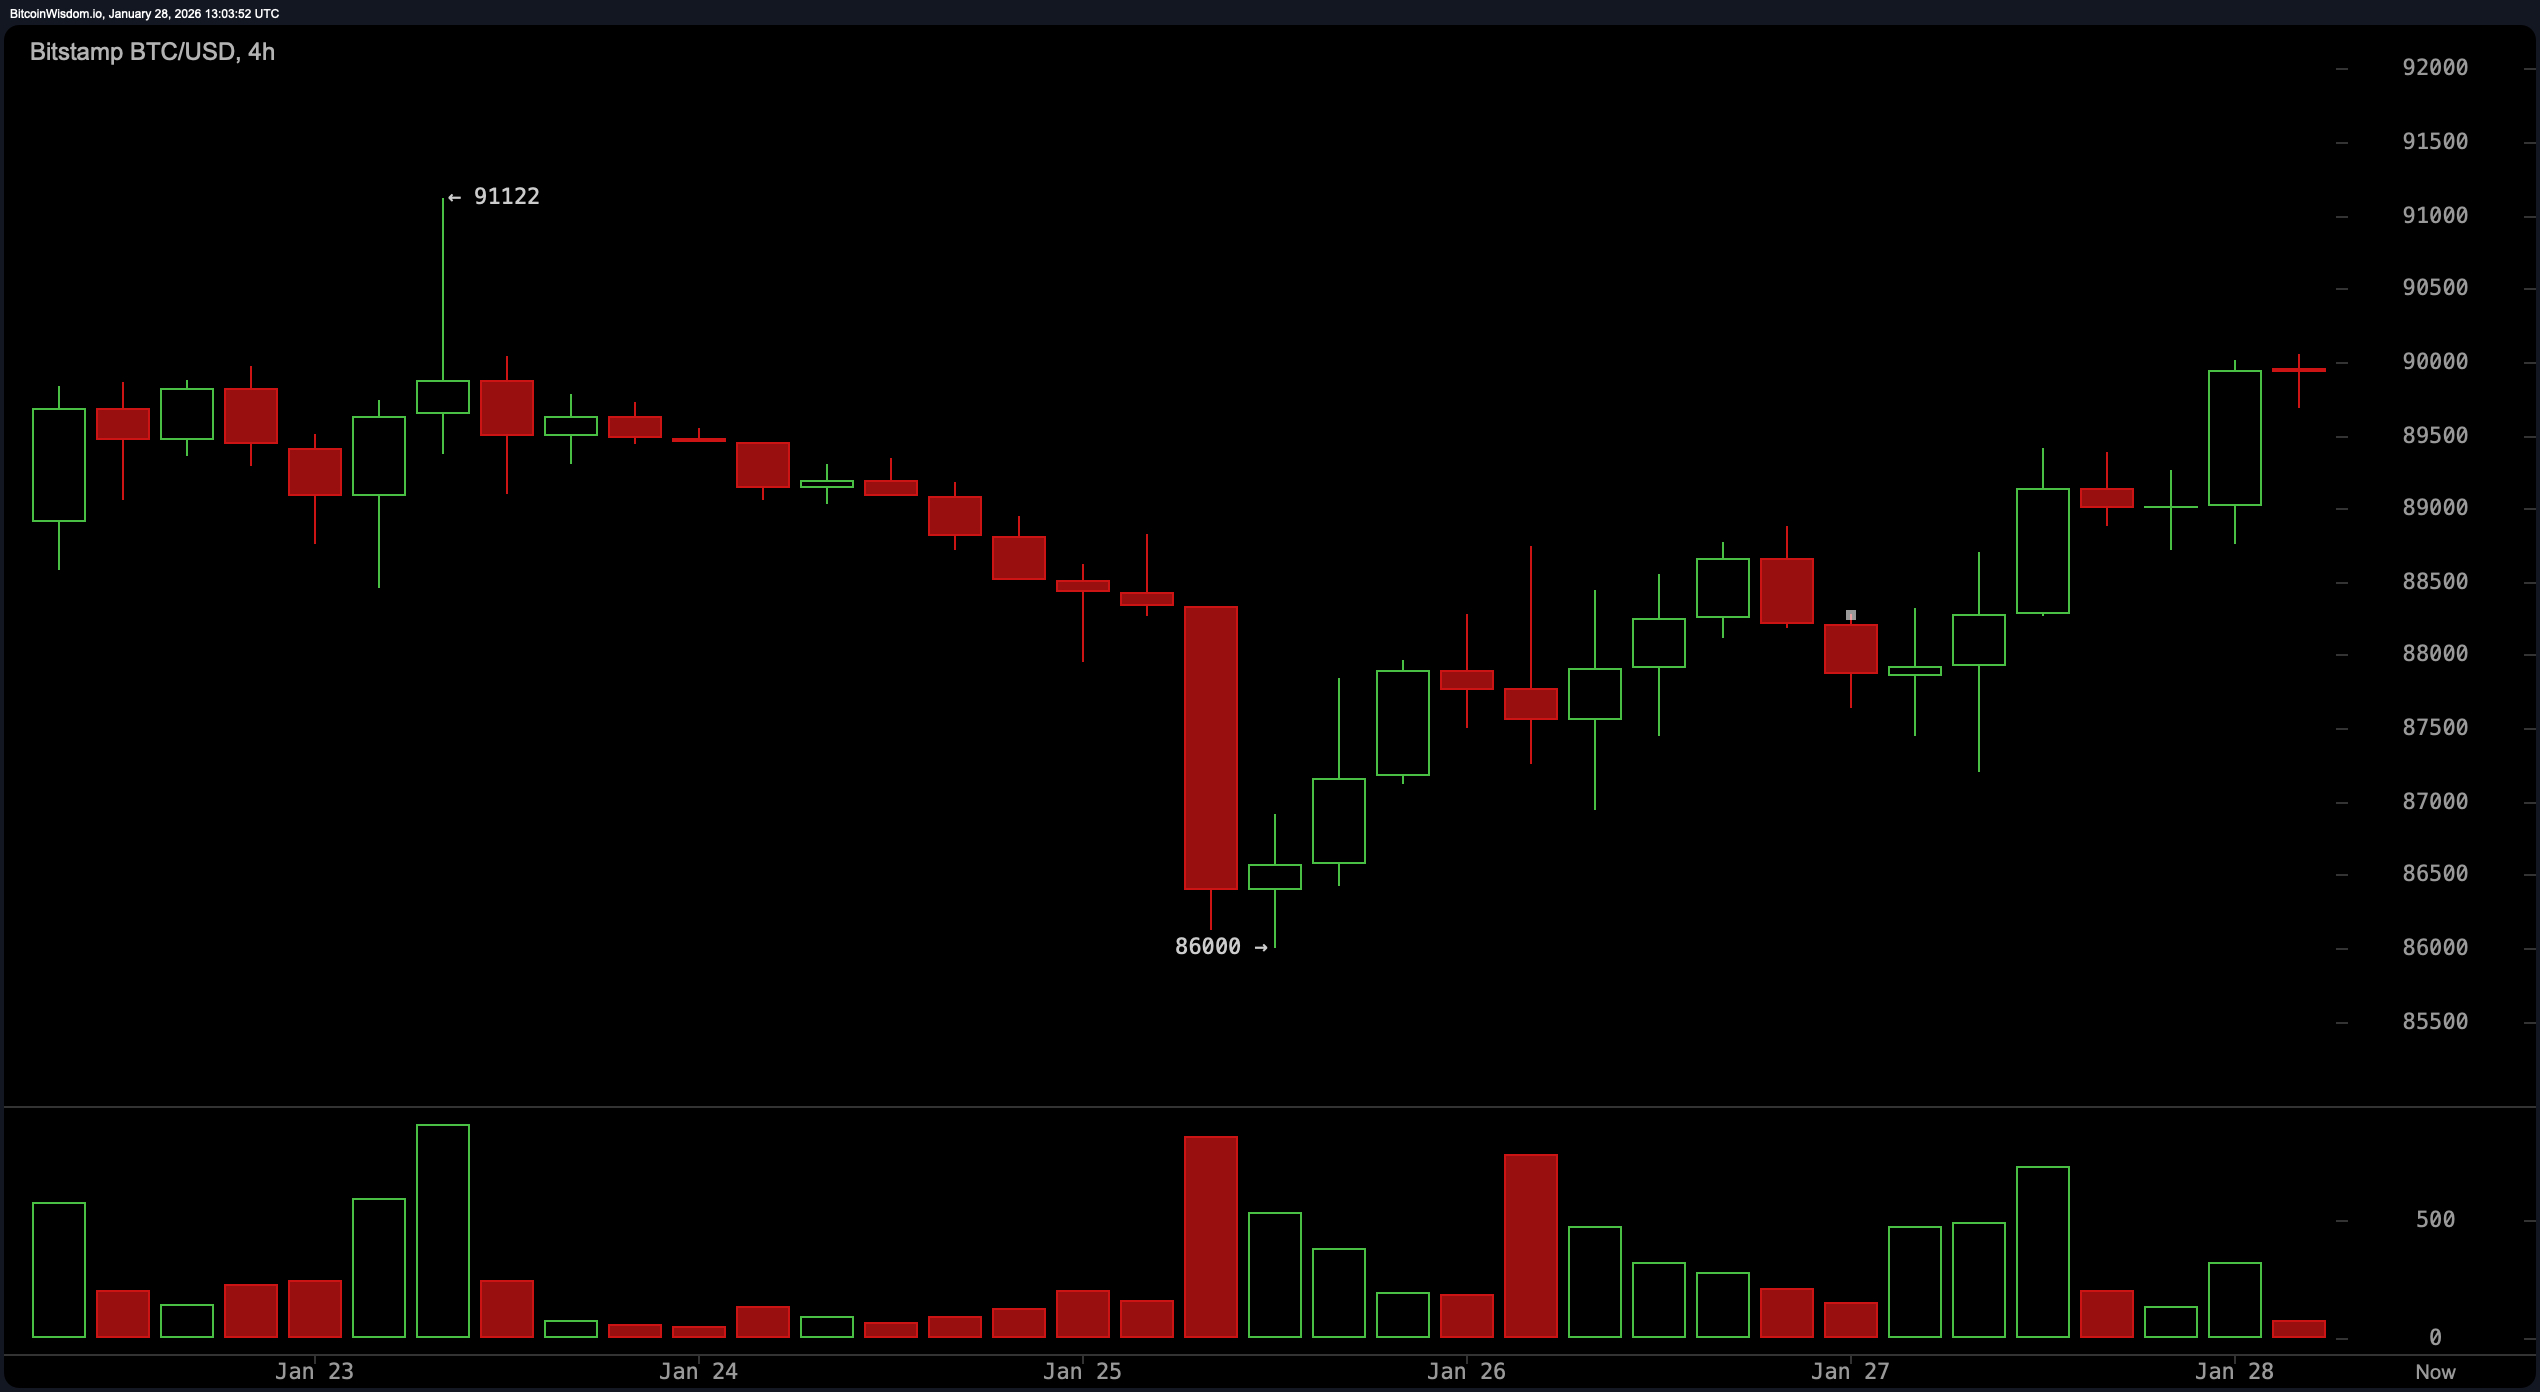
Examining the 4-hour timeframe reveals that Bitcoin is consolidating after its recent upward push since hitting lows near January 25th at about $86K. The price action forms what resembles a rounded bottom pattern—a classic indicator signaling gradual recovery phases. Prices have been climbing incrementally in stair-step fashion but face resistance between approximately $90K and just over that level like an exclusive club’s velvet rope: allowing some entry yet with hesitation.
A modest buildup in momentum can be observed here but lacks accompanying volume spikes typically necessary for confirming breakout moves convincingly — thus suggesting caution as this structure tests overhead barriers.
The hourly chart paints an even more optimistic picture with Bitcoin exhibiting mildly bullish tendencies following its recent trough at roughly $87,197.
The asset has recorded higher lows and highs while consolidating tightly just below its latest peak around $90,048.
Although momentum remains intact, declining volume indicates that some pause may be imminent — either as part of minor correction or simply catching breath before another leg up.
Bargain hunters are eyeing dips within the range spanning approximately $88,700–$89,000 provided reversal candlesticks confirm buying interest.
Short-term targets cluster slightly above $90,000,. a successful breakout beyond which could trigger rapid upside acceleration.
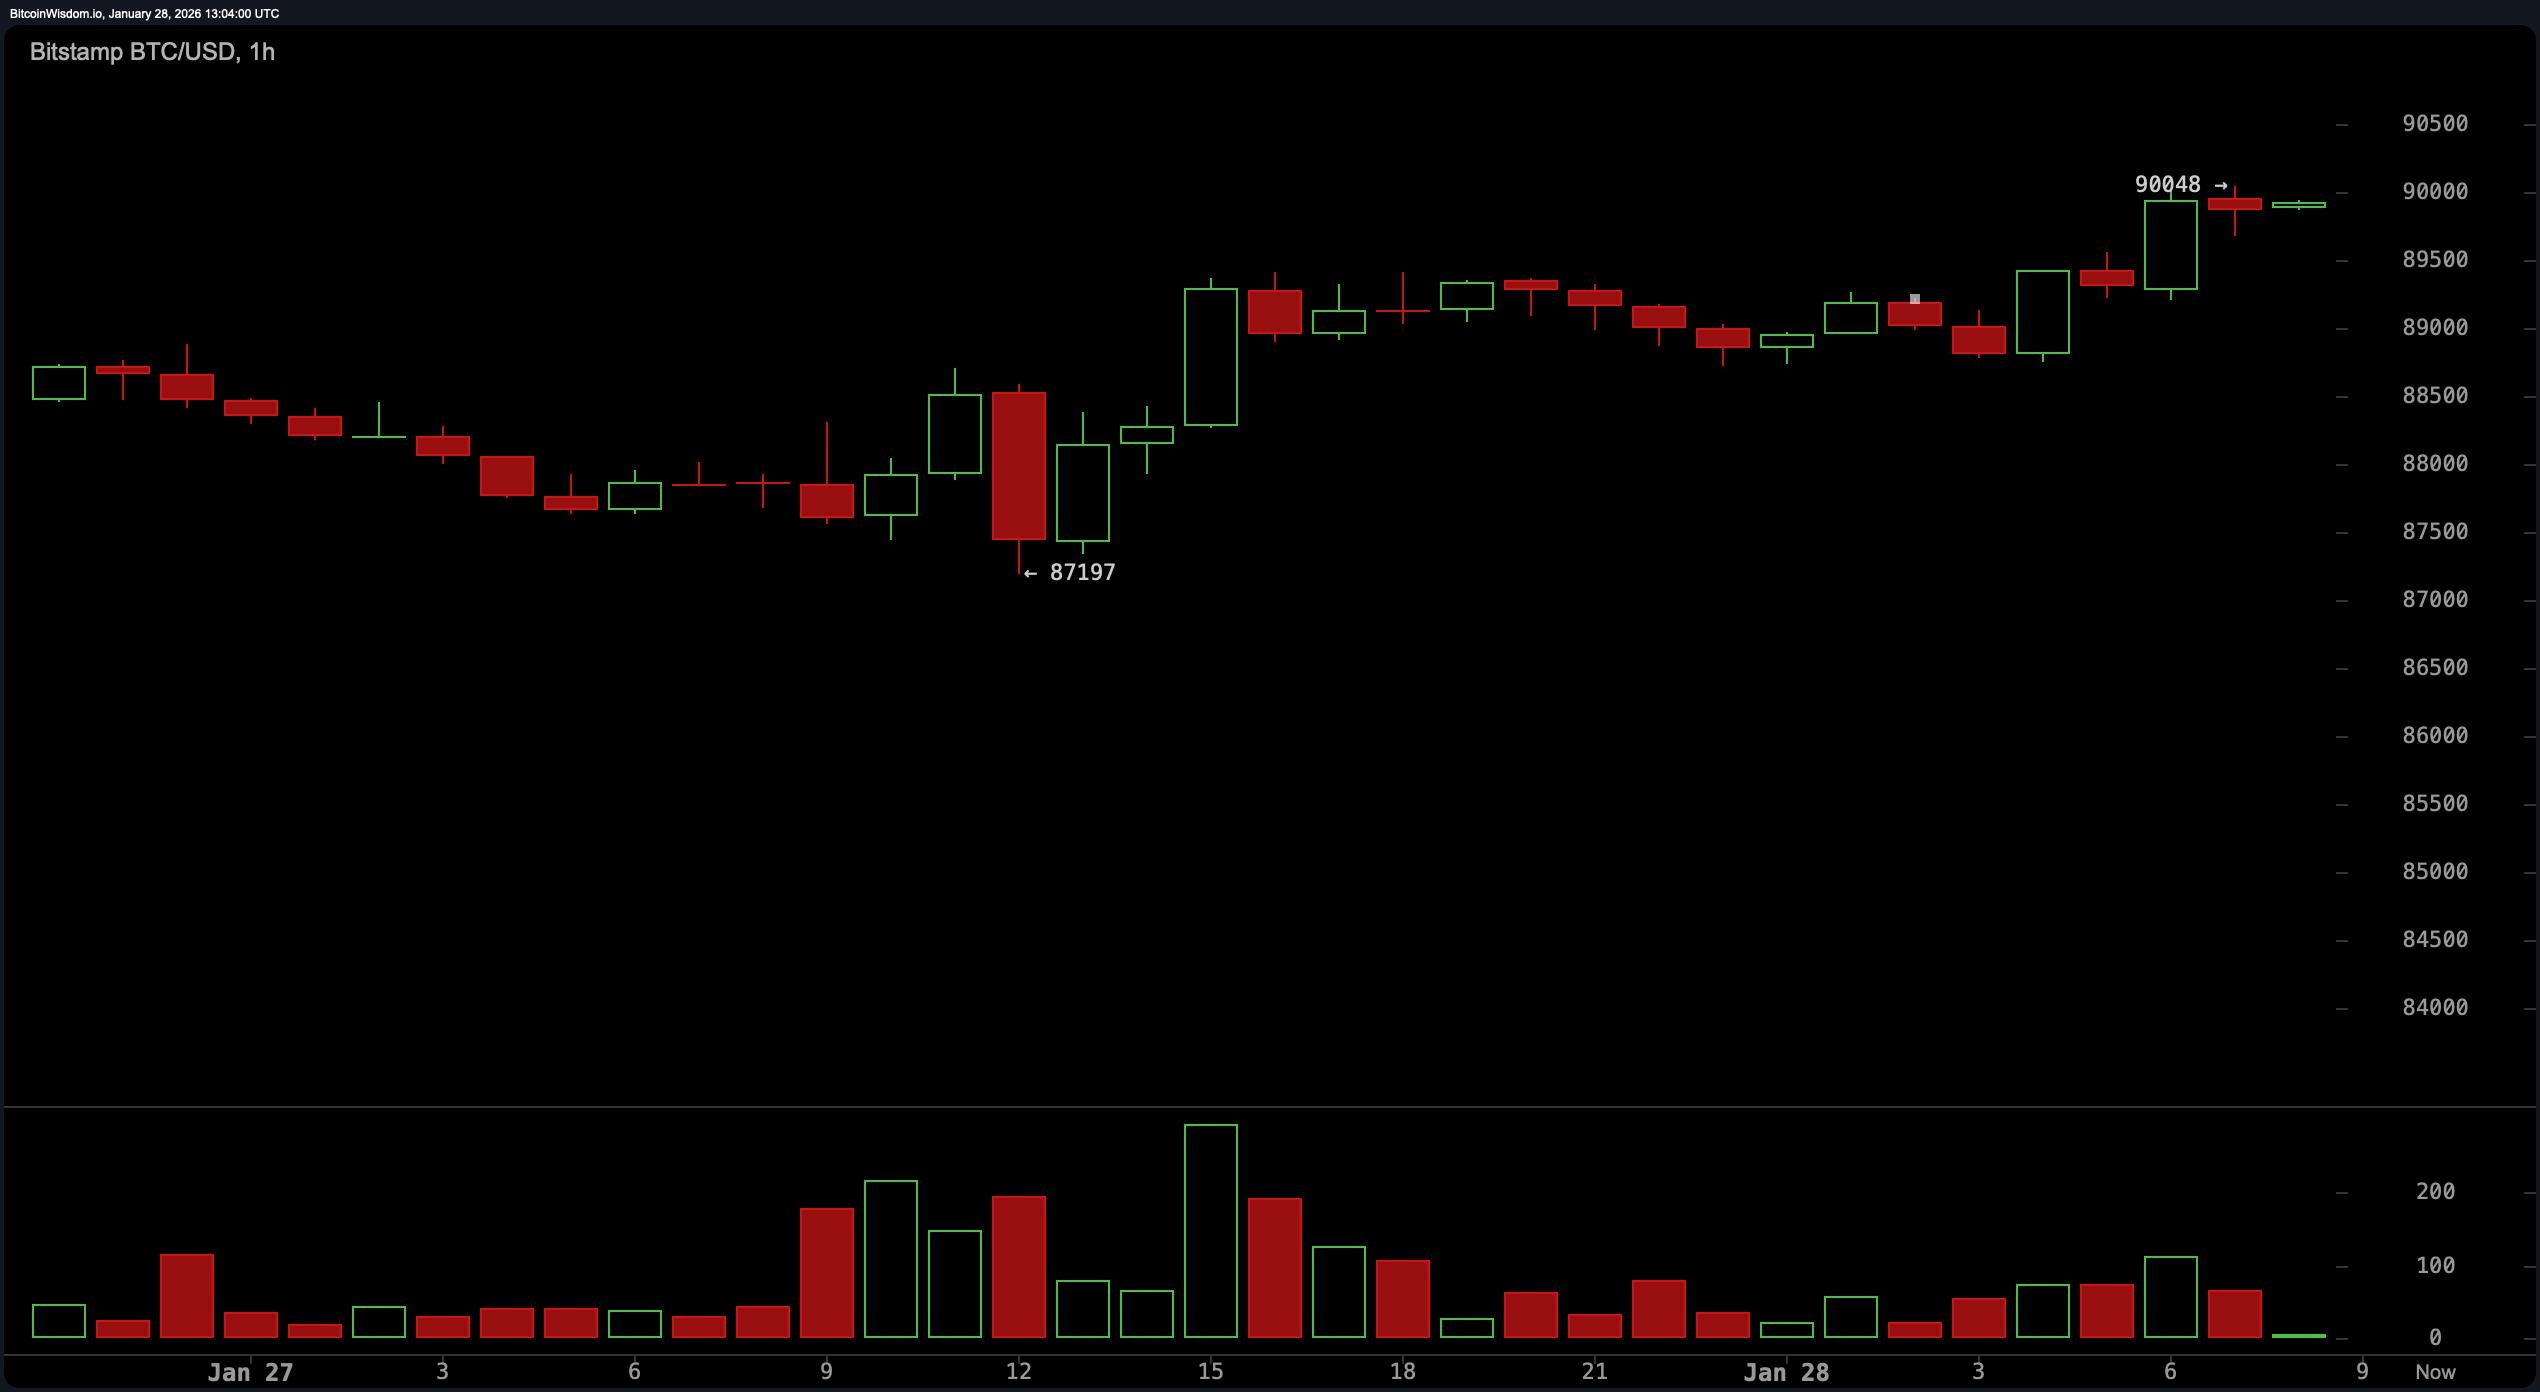
$BTC/USD (Bitstamp) – 1-hour Chart (Jan 28, 2026)