
Bitcoin’s “Buy Zone” Meme Resurfaces Amidst the ETF Landscape—What It Implies
Every so often, a familiar Bitcoin narrative reemerges, typically right when price action loses its excitement.
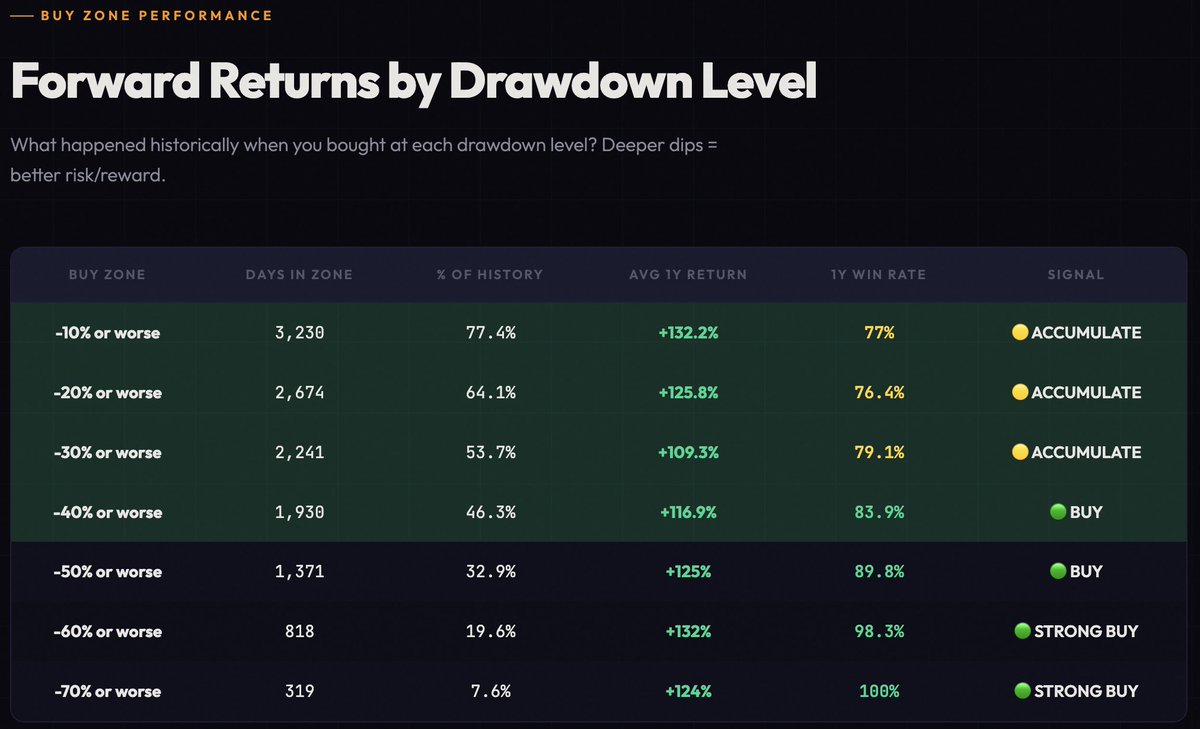
This week, PricedinBTC reignited the conversation with a compelling chart titled “Forward Returns by Drawdown Level.”
The key takeaway? Purchasing Bitcoin during a 50% price drop historically yields about a 90% chance of profit within one year and an average return close to 125%. The message concludes emphatically with “LOCK IN,” sounding both like advice and a dare.
People share such visuals much like they save workout routines—because sharp declines can overwhelm even seasoned holders who claim emotional detachment. Having clear-cut rules provides mental clarity—a boundary to act upon without rehashing every dip’s anxiety.
This meme gains traction now as Bitcoin hovers near $68,000 after its last peak. The drawdown currently sits around 40-45%, teetering close enough that continued downward pressure might push it into the critical -50% zone.
The chart frames this dip as almost inevitable and comforting based on historical precedent. Yet history also warns us: according to iShares research, there have been four drops exceeding 50% since 2014. The three most severe averaged an approximate 80% plunge with recoveries taking nearly three years in most cases.
The gap between “a year later”s gains” and enduring the painful decline tests investors’ resolve profoundly. Today’s challenge unfolds amid new market dynamics including spot ETFs, interest rate outlooks, dollar strength, and options hedging—all observable in real time.
The Critical -50% Threshold Feels Like a Beacon—and It’s Close
Using Bitcoin’s previous high above $126K as reference points places key levels at familiar milestones: -50% near $63K, -60% around $50K, and -70% roughly at $38K. With current prices about $68K, that first threshold is just within reach by several thousand dollars.
This proximity transforms abstract numbers into actionable plans for many investors—some accumulate cash awaiting the drop while others buy early fearing missing out or freeze once it hits because reality feels harsher than charts suggested.
The meme serves psychologically by simplifying complexity into one clear trigger point—but once triggered,the experience expands again as prices continue fluctuating beyond that mark. Here iShares’ historical data reminds us many successful entries endured extended uncertainty or deeper falls before rebounds arrived.
Succeeding with Bitcoin isn’t merely about buying early—it requires patience through volatility over long periods. Many veterans recall moments of premature selling—I personally own an expensive HDMI cable bought via Dogecoin back in 2014 illustrating missed opportunities vividly!
Spot ETFs Turn Price Dips Into Visible Daily Metrics
Spot bitcoin exchange-traded funds (ETFs) have introduced transparent daily tracking mechanisms everyone can monitor . As of February  ;13 , US spot bitcoin ETFs held approximately  ;1 .265 million BTC , representing assets under management near  ;$87 billion .
This magnitude influences how drawdowns ripple through markets : large ETF holdings may cushion prices during stable times but amplify sell-offs when outflows occur since these movements become quantifiable , visible , and easier to follow .
Over the past month , net outflows totaled roughly  ;55 ,665 BTC —a multi-billion-dollar shift given current valuations—that sustained withdrawals can weigh down price despite social media filled with optimistic “buy zone” chatter .
Conversely dip buyers gain fresh confirmation tools from observing flow stabilization patterns where capitulation manifests as slowing outflows eventually reversing direction .
Interest Rates And Inflation Shape Opportunity Costs Strongly
Much of bitcoin ’ s upcoming trajectory hinges on macroeconomic factors often overlooked yet crucial : yield curves , inflation trends , and broad risk pricing across asset classes .
In late January Federal Reserve maintained rates between  ;3 .5 %–3 .75 % while inflation eased notably—the US consumer price index hit  ;2 .4 % —fueling speculation for future rate cuts which tend to soften risk aversion among investors.
Cross-market indicators provide mood gauges : S&p500 proxy SPY reflects general appetite for risk,Treasury bonds via TLT show interest rate environment,and gold tracked through GLD captures defensive demand.
When these benchmarks favor safety/yield seeking behavior,BTC drawdowns feel heavier whereas easing conditions breathe life into dip buying activity.
Options Markets Signal Wider Expected Price Swings Than Simple Charts Suggest
While viral tables depict calm scenarios,the options market implies broader potential moves.On Unusual Whales platform,BTC options forecast implied volatility around .5656 translating into expected moves near 6.66 percent leading up to February 20th.
Larger implied fluctuations influence investor actions significantly.Dip buyers seek defined entry points plus rapid confirmations.Hedgers remain active amid persistent uncertainty.Short-term swings become baseline realities,making thresholds like minus-50 percent more waypoints than hard floors.
This perspective aligns again with iShares’ long-term data showing major recoveries frequently followed turbulent paths spanning years.A successful drawdown strategy depends less on endpoint timing than enduring volatile journeys calmly.
A Three-Pronged Framework For Upcoming Market Moves With Observable Levels To Track
An effective approach segments short-term possibilities conditionally,tied directly to measurable signals:
- If BTC stabilizes in low-to-mid-$60Ks range accompanied by ETF outflow deceleration toward zero plus cooling volatility,this suggests waning sell pressure evidenced via shrinking monthly net withdrawals;
- If inflation continues falling,rates hint at cuts,and overall market sentiment improves leading ETF flows positive then BTC could rally back toward prior highs;
- If negative macro shifts persist causing ongoing heavy outflows pushing BTC below minus-50 percent (~$63k) toward ~$50k level,it could signal deeper capitulation phases potentially extending further downwards;
The popular “buy zone” narrative offers simplicity,but real-time factors including ETF flows,rates environment,and market uncertainties dictate actual outcomes.This intersection forms today ’ s human-interest story—the clash between emotional desires for straightforward rules versus complex institutional forces shaping execution live.
Dollar Cost Averaging Strategy Coupled With Tactical Timing Can Mitigate Risks
Historically,this cycle phase has presented attractive buying windows.Yet repeated cautions stress “this time is different.”The traditional four-year cycle theory faces scrutiny alongside new realities such as US ETFs controlling ~6 percent supply plus corporate treasury accumulation surges.BTC markets today diverge markedly from those seen in prior cycles (2012–2020+).
I personally avoid trying precise timing due to emotional biases.One pragmatic method involves strategic dollar cost averaging(DCA): purchasing fixed amounts regularly but allocating slightly more funds onto exchanges creating cash reserves over time.These reserves enable opportunistic buys during dips already budgeted without risking impulsive decisions.This hybrid approach blends steady accumulation smoothing along with enhanced exposure during downturns.
Historically,
Bitcoin rarely remains below previous all-time highs from earlier cycles very long.At current ~$68k we align closely withe peak levels reached in late2021.In2022,BTC dipped briefly below2017 highs(~30 days)before embarkingonthree-year ascenttoward$126k.
Again,this article does not constitute personal investment advice.Any investment carries risks.But these insights highlight considerations relevantforBitcoin holders contemplating portfolio allocation adjustments amid evolvingmarket dynamics.
.....”>