As of March 21, Bitcoin ($BTC) is hovering around $70,725. It finds itself caught between the increasing accumulation by long-term holders and a persistent trend of on-chain realized losses that indicate weak demand above the $70,000 mark.
This tug-of-war has led to a constricted price movement for nearly two weeks. The resolution of this situation will likely dictate whether $BTC will break out decisively or revisit lower support levels.
Lack of Confidence Among Bitcoin Holders
The Net Realized Profit/Loss (24h Moving Average) chart from Glassnode for $BTC, spanning January 29 to March 20, reveals that this metric has predominantly remained in negative territory throughout this timeframe. The lowest point was approximately -$240 million around February 7, coinciding with a sharp decline in price near $62,000.
Since then, net realized losses have moderated to a narrower range between about -$25 million and -$50 million through mid-to-late March. There were brief moments when it flickered into positive numbers on February 9 and February 14 as well as early-to-mid March; however, none sustained these gains.
The latest figures from March 18-19 still reflect negative values in the vicinity of -$25 million even though prices had risen back up to $74,000 before retracting again.
If you’re interested in more insights like these regarding tokens? Subscribe to Editor Harsh Notariya’s Daily Crypto Newsletter here.
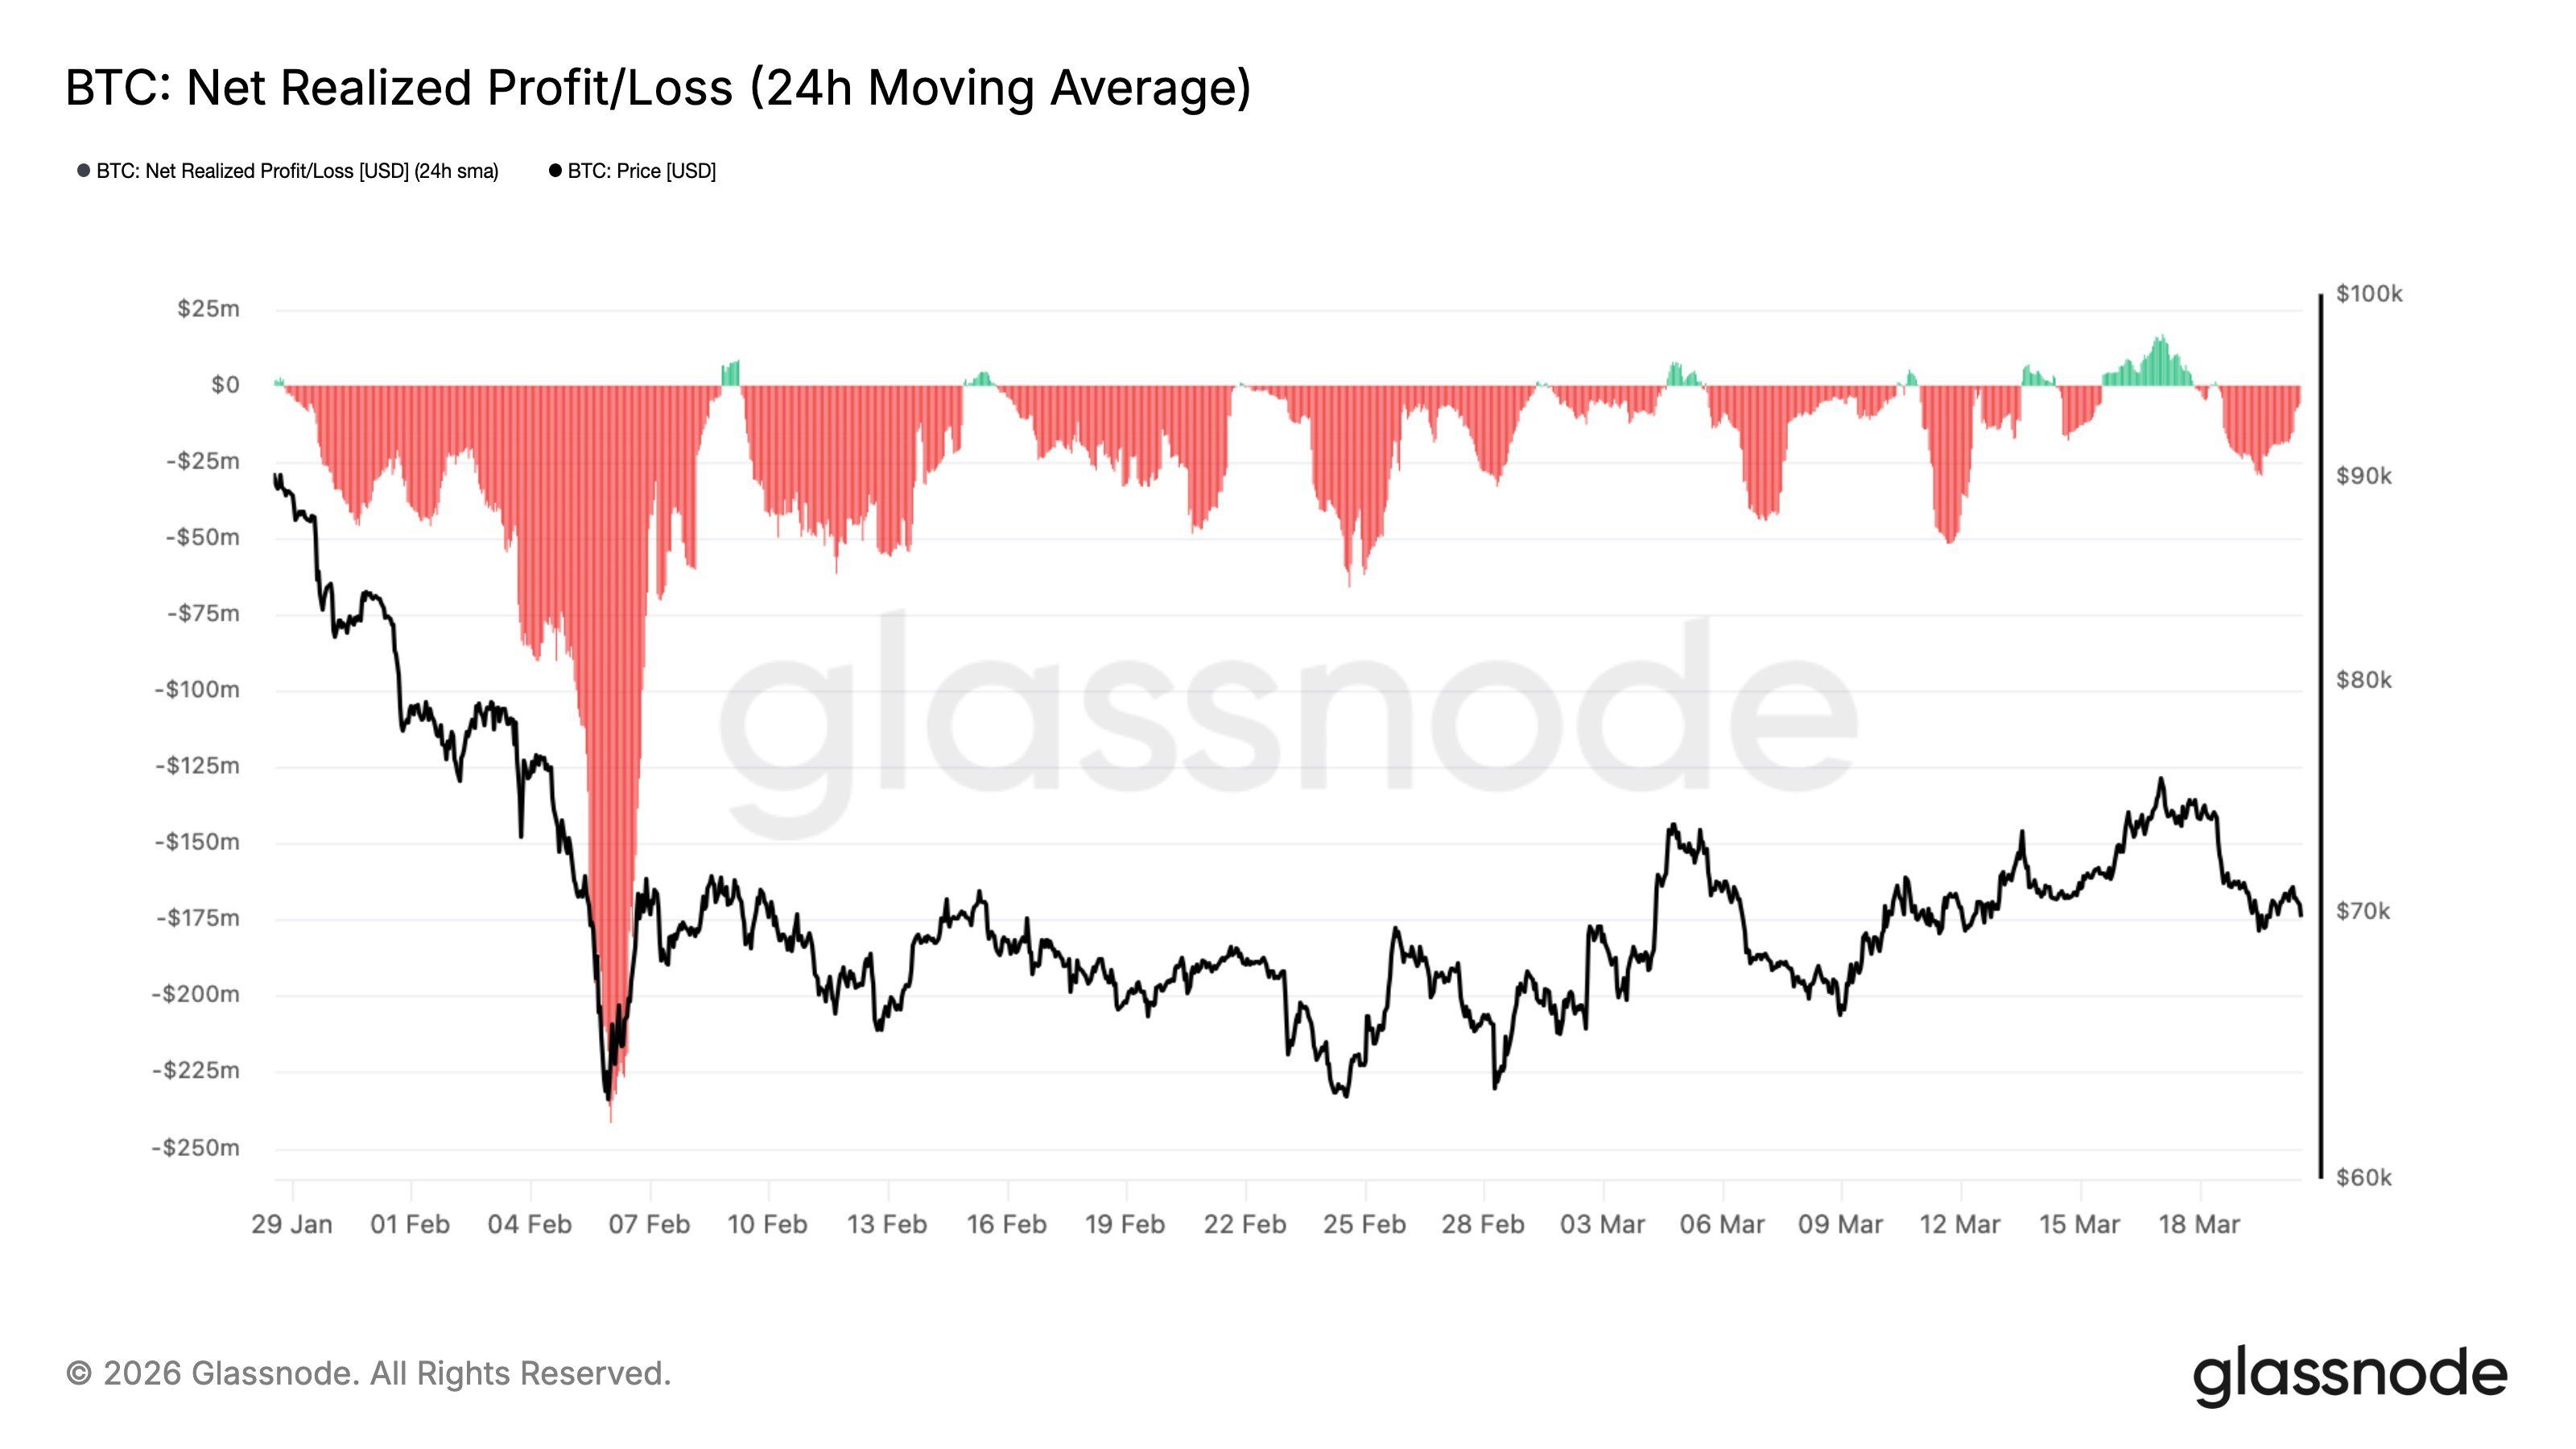
Bitcoin Net Realized P/L. Source: Glassnode
This information is crucial because extended periods of negative net realized profit/loss suggest that many market participants are holding assets at costs higher than current prices.
Investors who entered during the late rally in early 2025 remain at a loss; their hesitance to sell isn’t translating into upward pressure on prices either.
For this metric to shift sustainably into positive territory,$BTC must maintain levels above recent buyers’ average cost basis—estimated between $72,000 and $75,000 according to price charts.
Pessimism Among Long-Term Holders Remains Low
In contrast with ongoing pressures from realized losses is the narrative presented by Glassnode’s Long-Term Holder (LTH) supply chart. Total supply held by long-term holders reached its lowest point at approximately 14.46 million $BTC around February 4-5—just as prices fell sharply towards cycle lows near $62K.
Since then LTH supply has steadily increased reaching about 14.61 million $BTC as recorded on March 20—a total gain nearing 150K $ BTC over six weeks .
The trajectory indicated by the orange line shows consistent growth despite fluctuations within price ranges between $63K–75K.
Bitcoin LTH Supply.Source:Glassnode
The divergence seen across both charts holds significance.Long-term holders continue acquiring coins during every dip which effectively reduces liquid supply.
Nevertheless , their accumulation hasn’t been enough yet push prices past resistance established at $75 ,850.The constraints imposed by limited supplies are evident but demand coming from short-term investors along with institutional players hasn’t combined forcefully enough yet overcome barriers overhead.
Could Bitcoin Be Approaching A Ceiling?
Currently priced at roughly 70 ,725.Bitcoin finds itself positioned within what’s known as Bollinger Band squeeze.The upper band recedes downwards towards an approximate value standing close toward 74 ,636 ; while middle band rests nearby 70 ,366 ; lastly lower band ascends approaching 66 ,097.Tightening bands imply contraction occurring volatility —historically foreshadowing directional shifts forthcoming.

Bitcoin Price Analysis.Source:TradingView
On March17th,Bitcoin peaked hitting highs closeto75kbefore experiencing rejection via two candles pushing belowthe74k threshold confirmingthis levelasresistance.Belowcurrent pricing liesfirst visible supportat68k865followedbylowerBollingerBandat66k097and deeper floor restingaround62k891.
The setup presents clear binary outcomes.A daily closing figure surpassing ( $75{850} )—with backing provided through favorable flips concerning netrealizedP&L—would eliminate primary obstacles over head allowing movement toward78{000}.Conversely,a drop beneath68{865} would affirm insufficient absorption capabilities relatedtoLongTermHolderaccumulationin lightofsellpressurepresentcurrently thus opening doorsfor retesting65{000}-66{000} zone.
The upcoming quarterly options expiry set forMarch27th features( $14 billion) worthofopeninterestassociatedwithBitcoin servinglikely catalyst paving waytowardsresolutionregardingcurrentrange.Until event concludes,BollingerBandsqueezeindicatesmarketholdingitsbreathawaitingmovementdirectionyetunsettled.
This article first appearedonBeInCrypto titled“WillDemandExhaustionLimitBitcoinsUpsideTo( $70 {00}? ”