A recent update from crypto analyst Stockmoney Lizards on X indicates that the current Bitcoin market setup might be presenting bears with an ideal chance to push prices down to $40,000. Accompanying his commentary was a chart illustrating Bitcoin’s decline below a key resistance level since falling under $100,000, suggesting a clear continuation pattern for traders anticipating further downturns.
Despite the chart drawing parallels to a similar bearish trend observed in 2022, the deeper analysis behind his post reveals a more nuanced outlook regarding Bitcoin’s potential next moves.
The Bearish Scenario Bears Are Counting On
In the shared chart, Stockmoney Lizards highlighted how Bitcoin’s recent breakdown mirrors its 2022 behavior when it rejected significant resistance and plunged sharply into what eventually became an extensive accumulation phase. The current price action shows rejection just above the $100,000 mark followed by slipping beneath the weekly EMA50. This shift places Bitcoin within a range comparable to where accumulation occurred during that earlier cycle.
Overlaying this new price movement onto previous patterns suggests that the downward trajectory appears almost inevitable. This creates an impression that Bitcoin is gearing up for a natural drop toward $40,000 over upcoming weeks or months. Presently trading around $90,240, such a fall would erase about 55% of its value—wiping out nearly all gains made over two years.
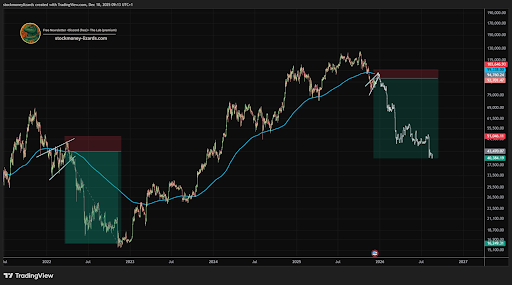
Bitcoin Price Chart. Source: @StockmoneyL on X
The Analyst’s True Perspective Beyond The Perfect Short
Following widespread attention on his post, Stockmoney Lizards clarified that his suggestion for traders to short down to $40,000 was deliberately overstated and should not be interpreted literally—markets rarely move so predictably.
He emphasized he does not expect Bitcoin to enter an extended bear market collapse but rather anticipates consolidation phases with possible local lows being tested without prolonged breakdowns. Moreover, he pointed out that even if prices touched the weekly EMA200—a critical support level—it wouldn’t signal an end of bullish cycles but rather serve as part of normal market fluctuations. His midterm forecast actually leans toward upward momentum in Bitcoin’s price.
Prior to sharing this seemingly bearish outlook, Stockmoney Lizards had posted another analysis portraying Bitcoin nearing what he called “the endboss” at its weekly EMA50 indicator.
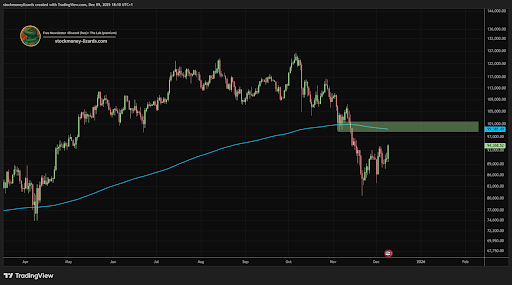
Bitcoin Price Chart. Source: @StockmoneyL on X
This earlier chart better reflects his actual stance: predicting proximity to major technical support and expecting upward movement through late December into Q1 2025. According to him, reclaiming and holding above the weekly EMA50 is crucial for initiating bitcoin’s next bullish phase.
Featured image generated using Dall.E & charts sourced from Tradingview.com