The cryptocurrency landscape is witnessing a notable split in investor behavior, as indicated by on-chain metrics and the dynamics of the derivatives market. Meanwhile, Bitcoin’s price remains relatively stable, exhibiting minimal fluctuations.
Current market data reveals that Bitcoin ($BTC) is priced at $68,094, reflecting a slight uptick of 0.06% over the past day.
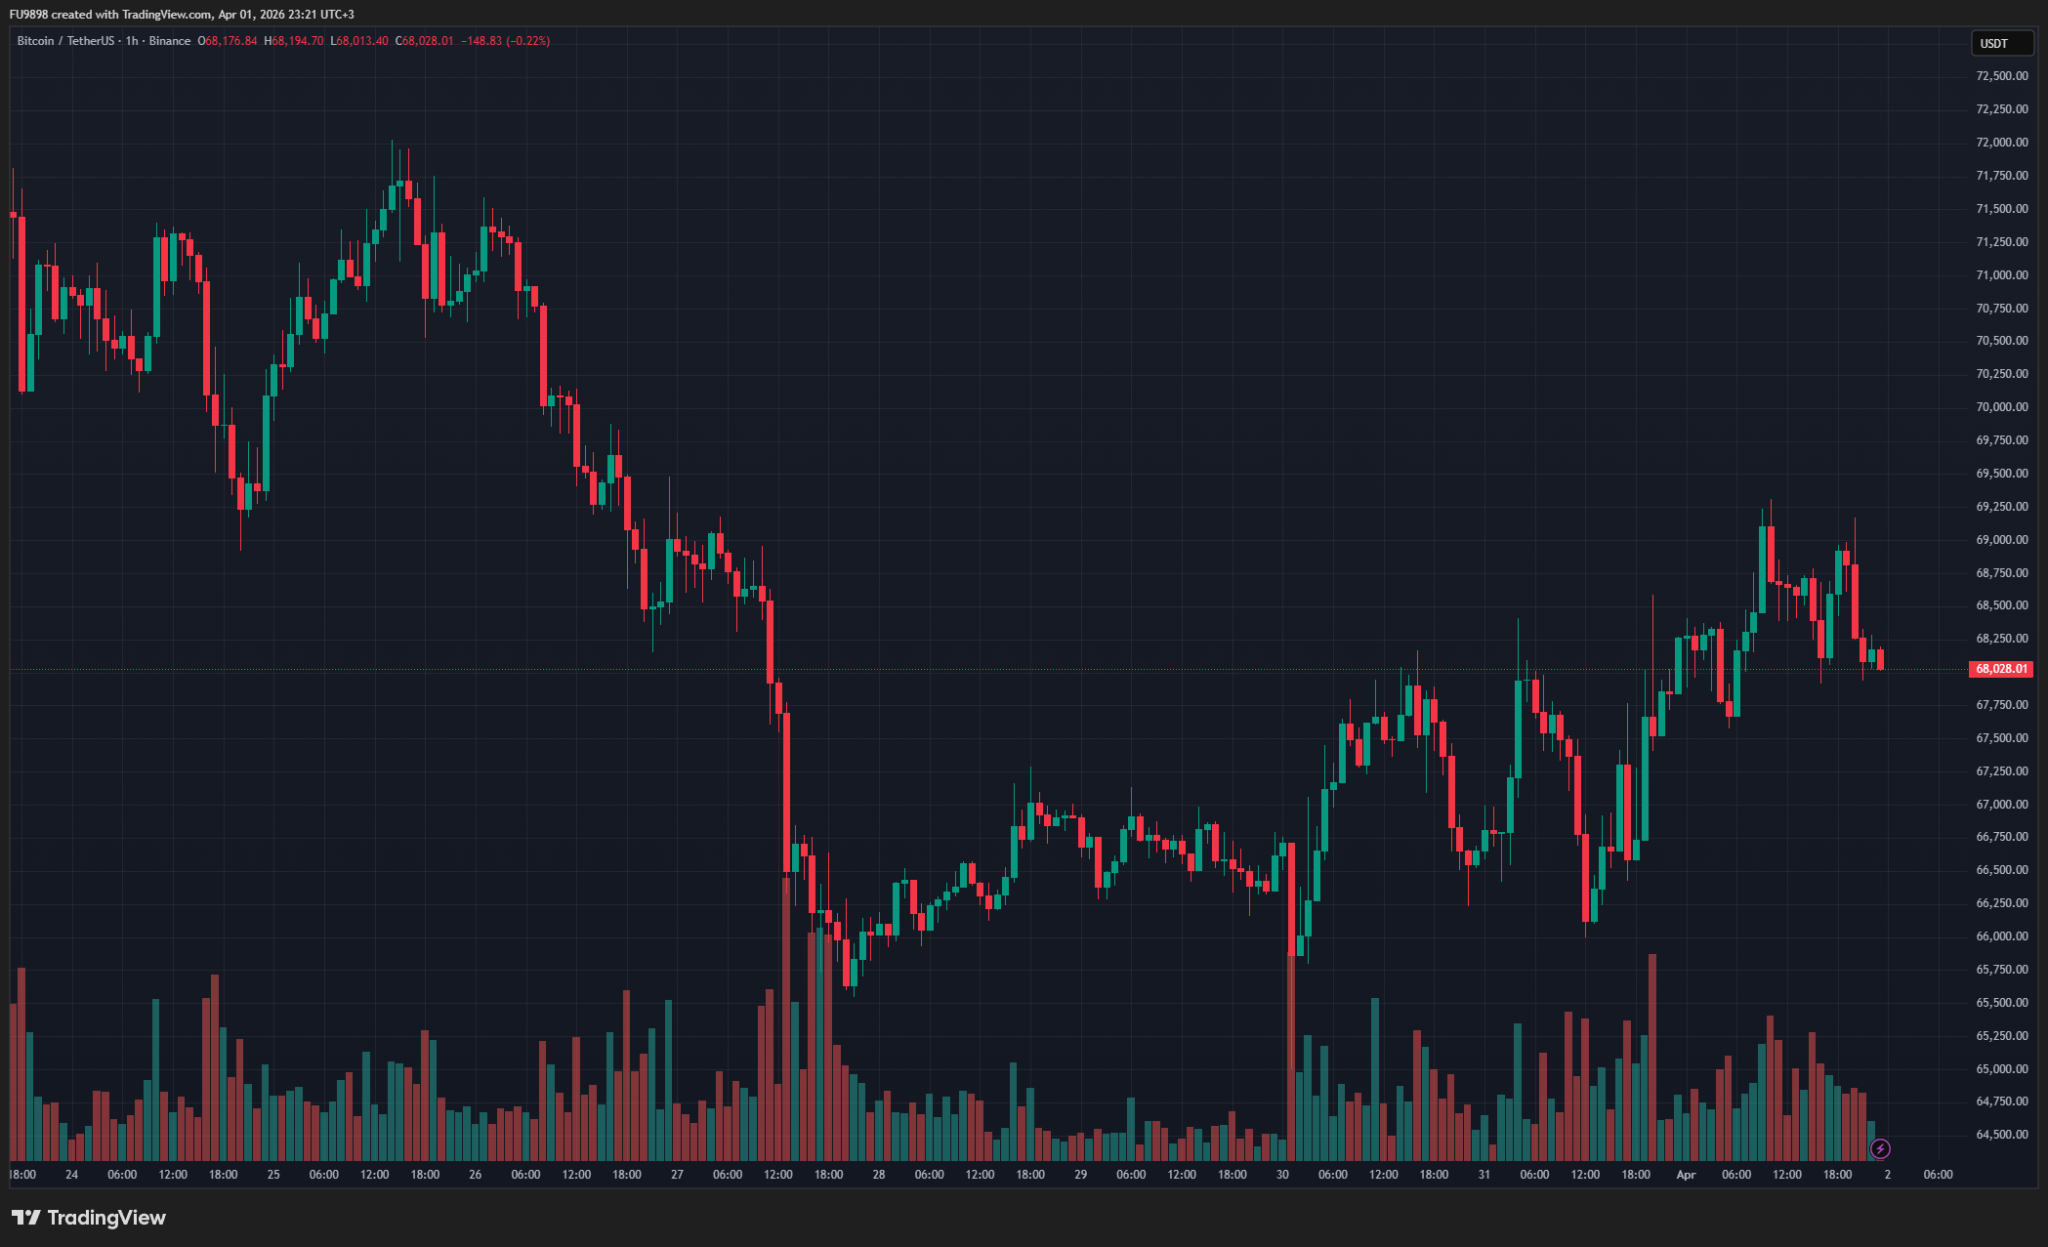
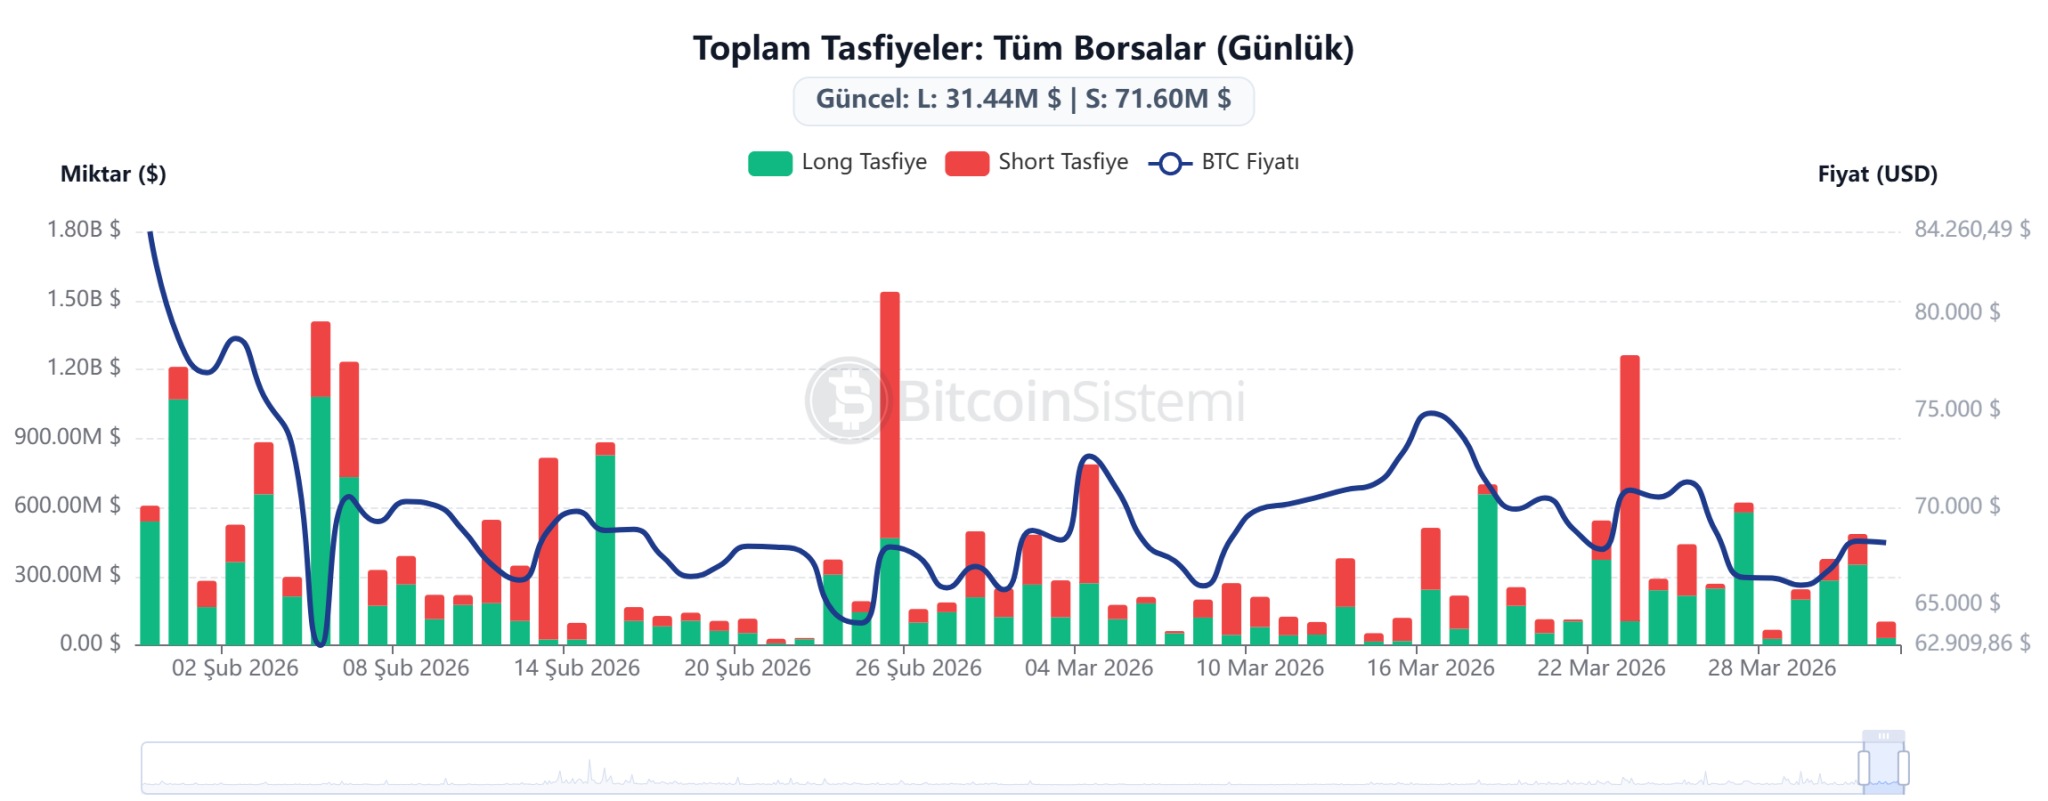
As prices remain trapped within a tight range, liquidations in the derivatives markets paint an intriguing picture. A total of $109.16 million was liquidated during this period; short positions represented $76.51 million or 70.1% of this total—indicating that those betting against upward price movements faced significant losses. Conversely, long position liquidations amounted to $32.65 million.
You can find more details regarding liquidation statistics here.
In contrast, the Fear and Greed Index—which gauges overall market sentiment—remains entrenched in “extreme fear” territory with a score of just 8 points. The index has consistently shown low readings over recent days (11 yesterday), last week (14), and last month (10), suggesting that investors are largely risk-averse and approaching the market with caution.
Related News
What Will Happen to Bitcoin Prices If Tensions Between U.S.-Iran Ease? Expert Insights Here
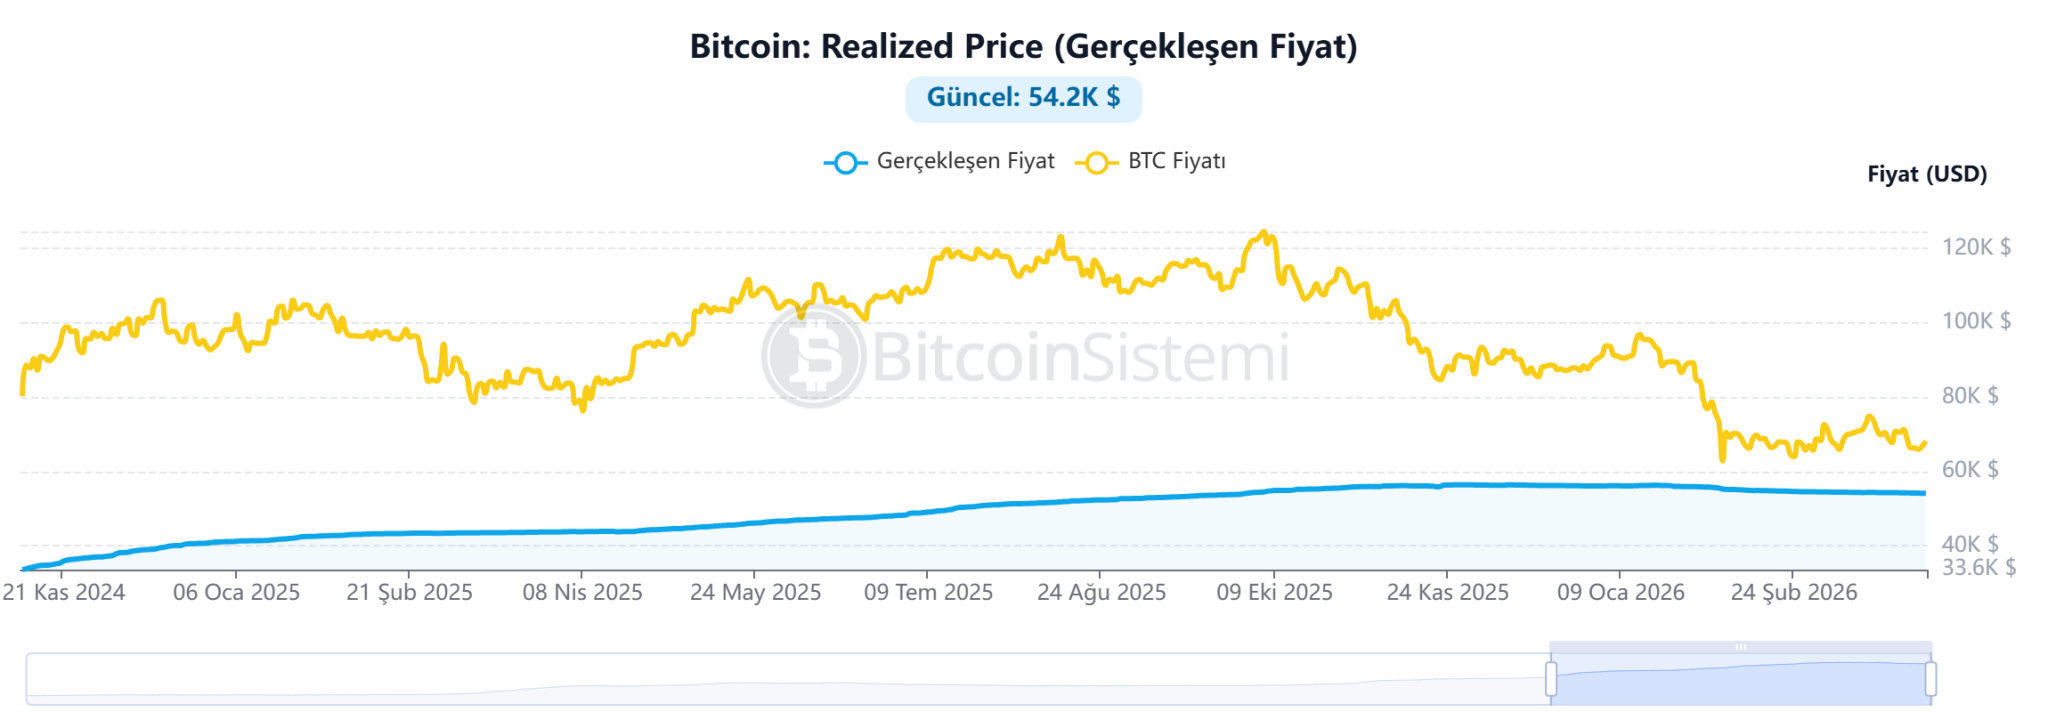
An analysis of on-chain data indicates that Bitcoin’s current pricing structure appears robust overall. The “realized price,” which reflects the average cost incurred by all network investors stands at $54,200; trading above this threshold suggests general profitability for holders and could serve as strong support moving forward.
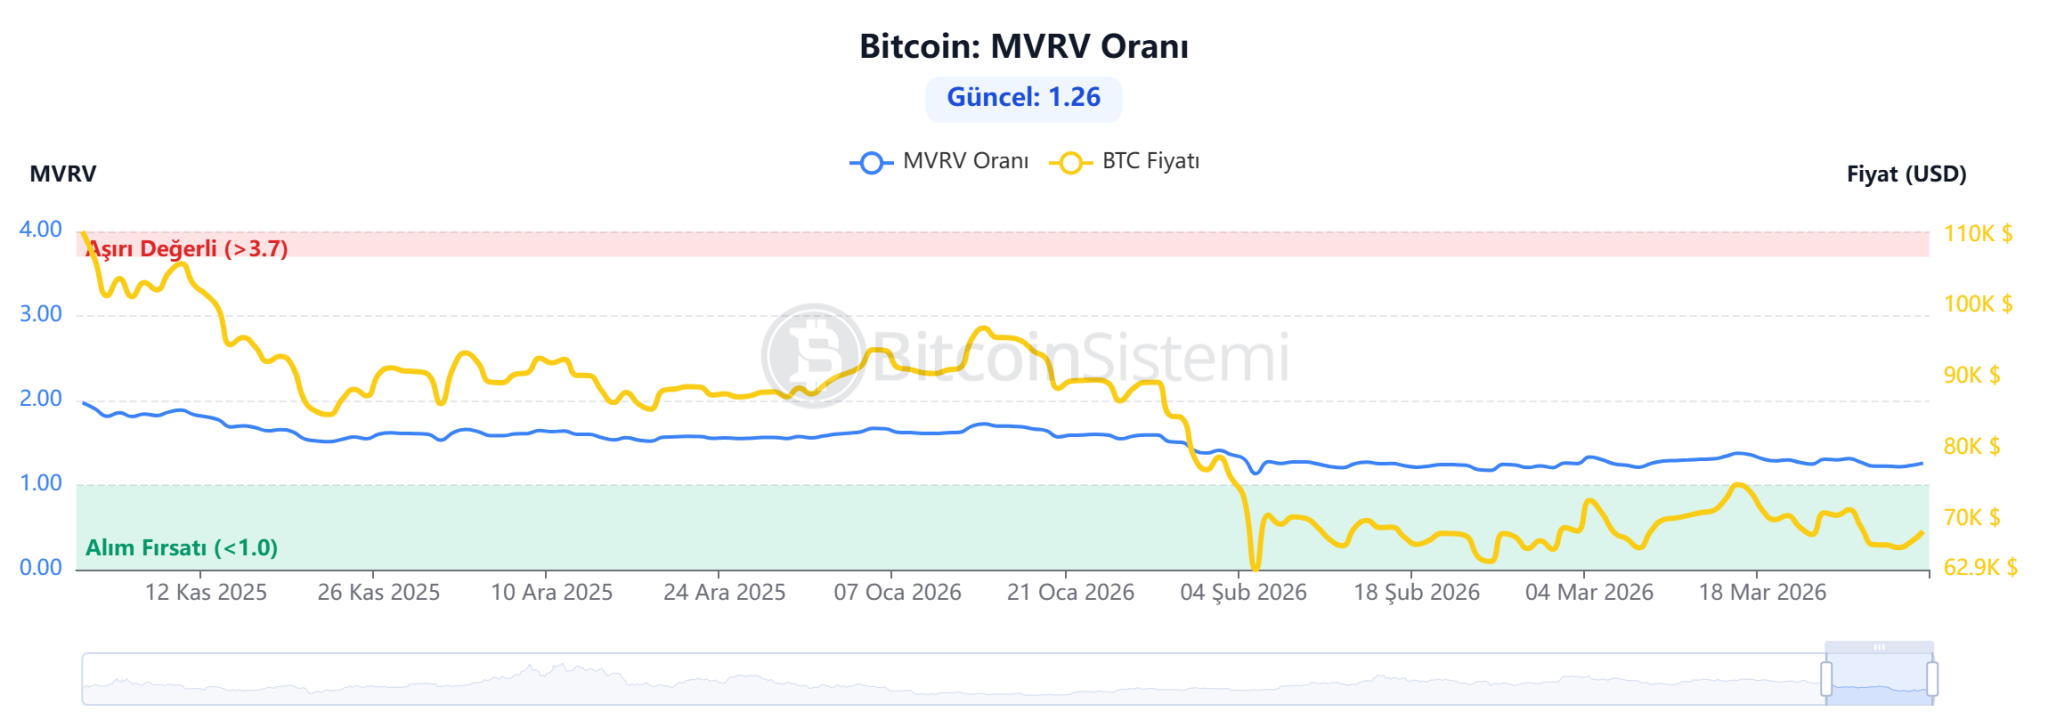
However, another key metric—the MVRV ratio—currently sits at 1.26 indicating that valuations are not excessively high nor historically low but rather oscillating within what experts consider an “equilibrium” zone. Values below 1 signal potential bottoming out while those exceeding 3.7 suggest bubble conditions with peak risks looming ahead according to expert analyses.
*This content does not constitute investment advice.*