As we move into April 2026, financial markets are preparing for what experts refer to as the “oil cliff.” This critical juncture is anticipated around April 19, when temporary strategies such as the release of strategic reserves and exemptions on specific oil supplies may come to an end.
This situation follows a ceasefire between the U.S. and Iran announced in early April, which led to a significant drop in crude oil prices. This decline provided a brief respite for risk assets like Bitcoin.
Transitioning from Geopolitical Relief to Supply Challenges
The two-week ceasefire declared at the beginning of April alleviated immediate concerns regarding potential disruptions in the Strait of Hormuz. As a result, oil prices plummeted by over 15% in just one session, with Brent and WTI dipping into the $92–$95 range at one point.
In response, Bitcoin saw positive movement, rising towards $72,000–$73,000 as decreased energy costs alleviated inflation worries and enhanced prospects for monetary easing.
Nevertheless, this truce has been labeled fragile. Analysts caution that if normal supply routes through vital chokepoints are not fully restored by around April 19th, there could be renewed upward pressure on oil prices.
Typically higher oil prices create challenges for Bitcoin by heightening inflation fears while delaying anticipated interest rate cuts from the Federal Reserve and tightening liquidity conditions affecting risk assets.
The Technical Landscape of Bitcoin: Mixed Signals Amidst Consolidation
The weekly chart (April 18, 2026 – 10:31 UTC) on Coinbase indicates that Bitcoin is trading near $76,312—a decrease of about 1% during this period—after reaching higher levels earlier in April.
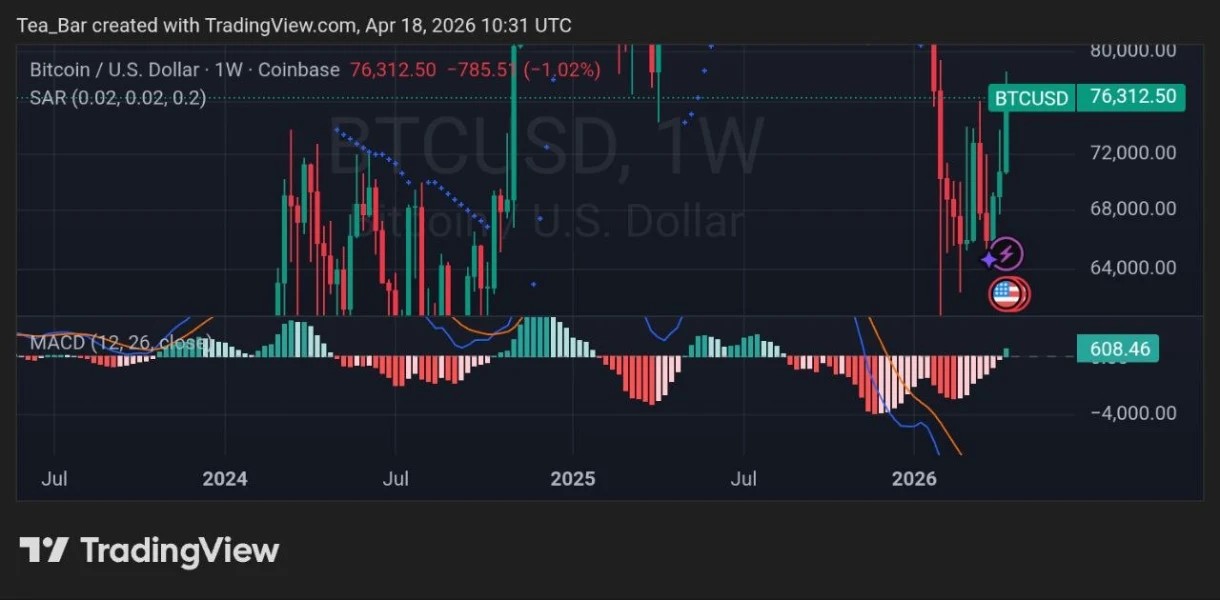
The Parabolic SAR remains above current price levels indicating short-term caution persists within higher timeframes; meanwhile MACD indicators suggest a corrective phase following previous volatility patterns.
On daily charts as of April 18 (10:30 UTC), price hovers around $76,294—also reflecting an approximate decline of about 1%. The Parabolic SAR dots remain close to current values while MACD (12-26-close) shows narrowing yet still positive histogram readings with blue lines positioned above orange ones.
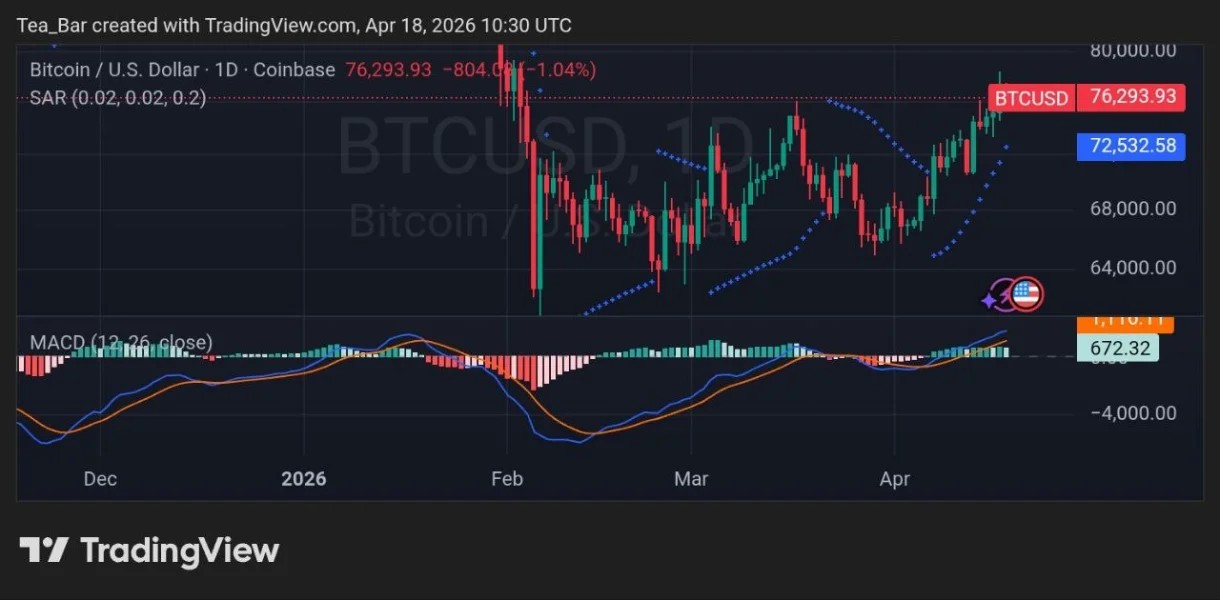
This suggests some underlying momentum that might facilitate stabilization or recovery should pressures related to oil ease off significantly enough.
Taken together overall sentiment surrounding Bitcoin appears resilient despite broader macroeconomic uncertainties—it continues digesting recent gains while maintaining key support levels amidst market fluctuations surrounding it all .
The Mechanism Behind Oil’s Impact on $BTC
The relationship between oil and bitcoin operates through various indirect channels; increased energy expenses elevate production costs—including those incurred by miners—and contribute towards heightened inflation expectations which can compel central banks toward tighter policies over extended periods—all factors constraining valuations across growth-sensitive assets like cryptocurrencies .
A prolonged reduction in crude prices generally encourages risk appetite , lowers real yields ,and reopens avenues for liquidity inflows back into both bitcoin & equities alike .
Critical Factors Traders Should Observe Moving Forward
Date set aside specifically—the “oil cliff” scheduled for Aprill19 represents an essential test case going forward ;if supply constraints resurface pushing crude back up toward or exceeding $100 per barrel then bitcoin may experience renewed downward pressure stemming from resurfacing inflationary concerns .
A favorable resolution coupled with additional diplomatic advancements however could enable stability within lower ranges allowing BTC potential tailwinds enabling tests against resistance situated closer towards$78k-$80k thresholds instead .
Meanwhile traders ought pay attention particularly closely around ranges situated between approximately ($74K-$76K); consistent holding alongside improving daily MACD signals would indicate resilience whereas breaking below could trigger tests downwards nearer supports hovering roughly($72K-$70K).
Disclaimer:
This article serves purely informational purposes only—not constituting any form financial advice whatsoever including investment recommendations or trading guidance offered herein ; opinions expressed herein derive solely based upon publicly accessible data along with personal interpretations made during writing process itself.
Please conduct thorough research before making decisions & consult qualified advisors where necessary ! TechGaged assumes no liability arising out losses incurred resulting from information presented throughout article contents .