As of December 27, 2025, Bitcoin is trading steadily at $87,382, boasting a market capitalization of approximately $1.74 trillion and recording a 24-hour trading volume near $30.6 billion. Throughout the day, its price fluctuated narrowly between $86,673 and $88,965 as the market appeared to brace itself for an imminent breakout. Across various timeframes—from hourly fluctuations to daily trends—the indicators suggest caution rather than certainty; it feels like watching a fuse burn down before an expected ignition.
Bitcoin Market Analysis
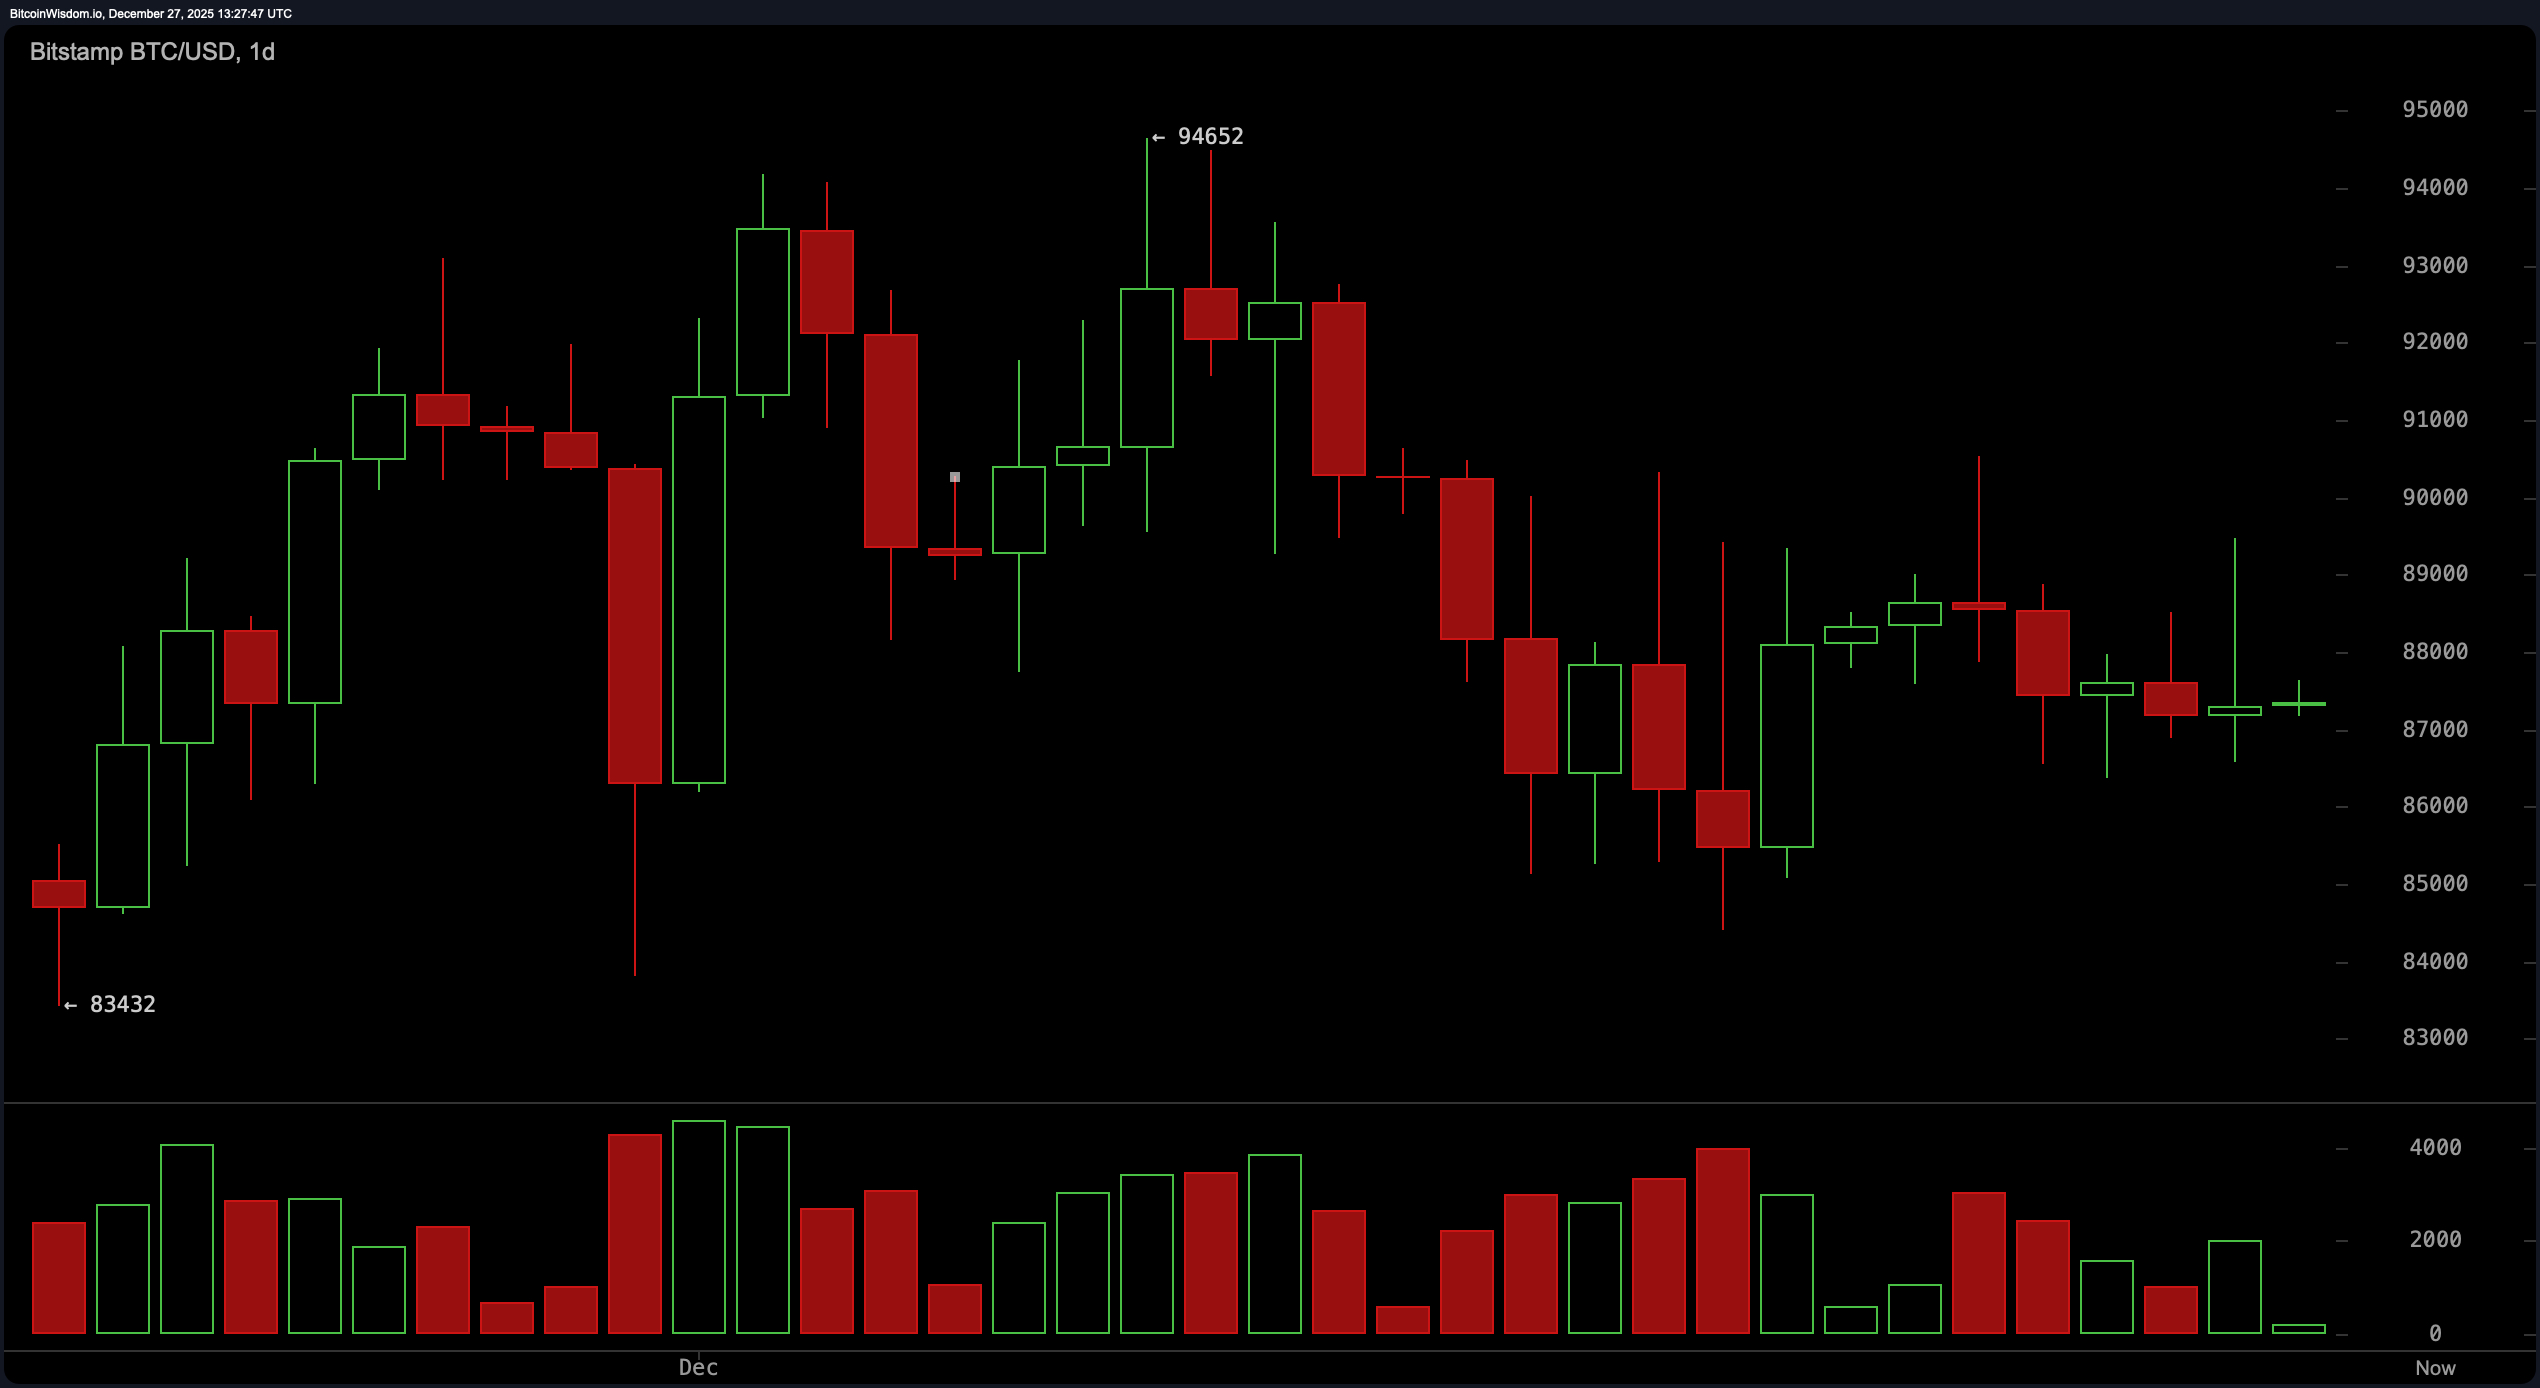
The daily chart reveals Bitcoin forming a pattern characterized by descending peaks and troughs—a classic bearish formation that signals weakening momentum without dramatic moves yet. After peaking close to $94,652 earlier this month, the price gradually declined into the range between $87,000 and $88,000 where it currently consolidates quietly.
More telling is the declining volume: diminishing buying interest often signals a pause before renewed activity. Traders should keep an eye on whether Bitcoin can reclaim the crucial resistance level around $90,000 with increased volume before confidently calling for bullish dominance.
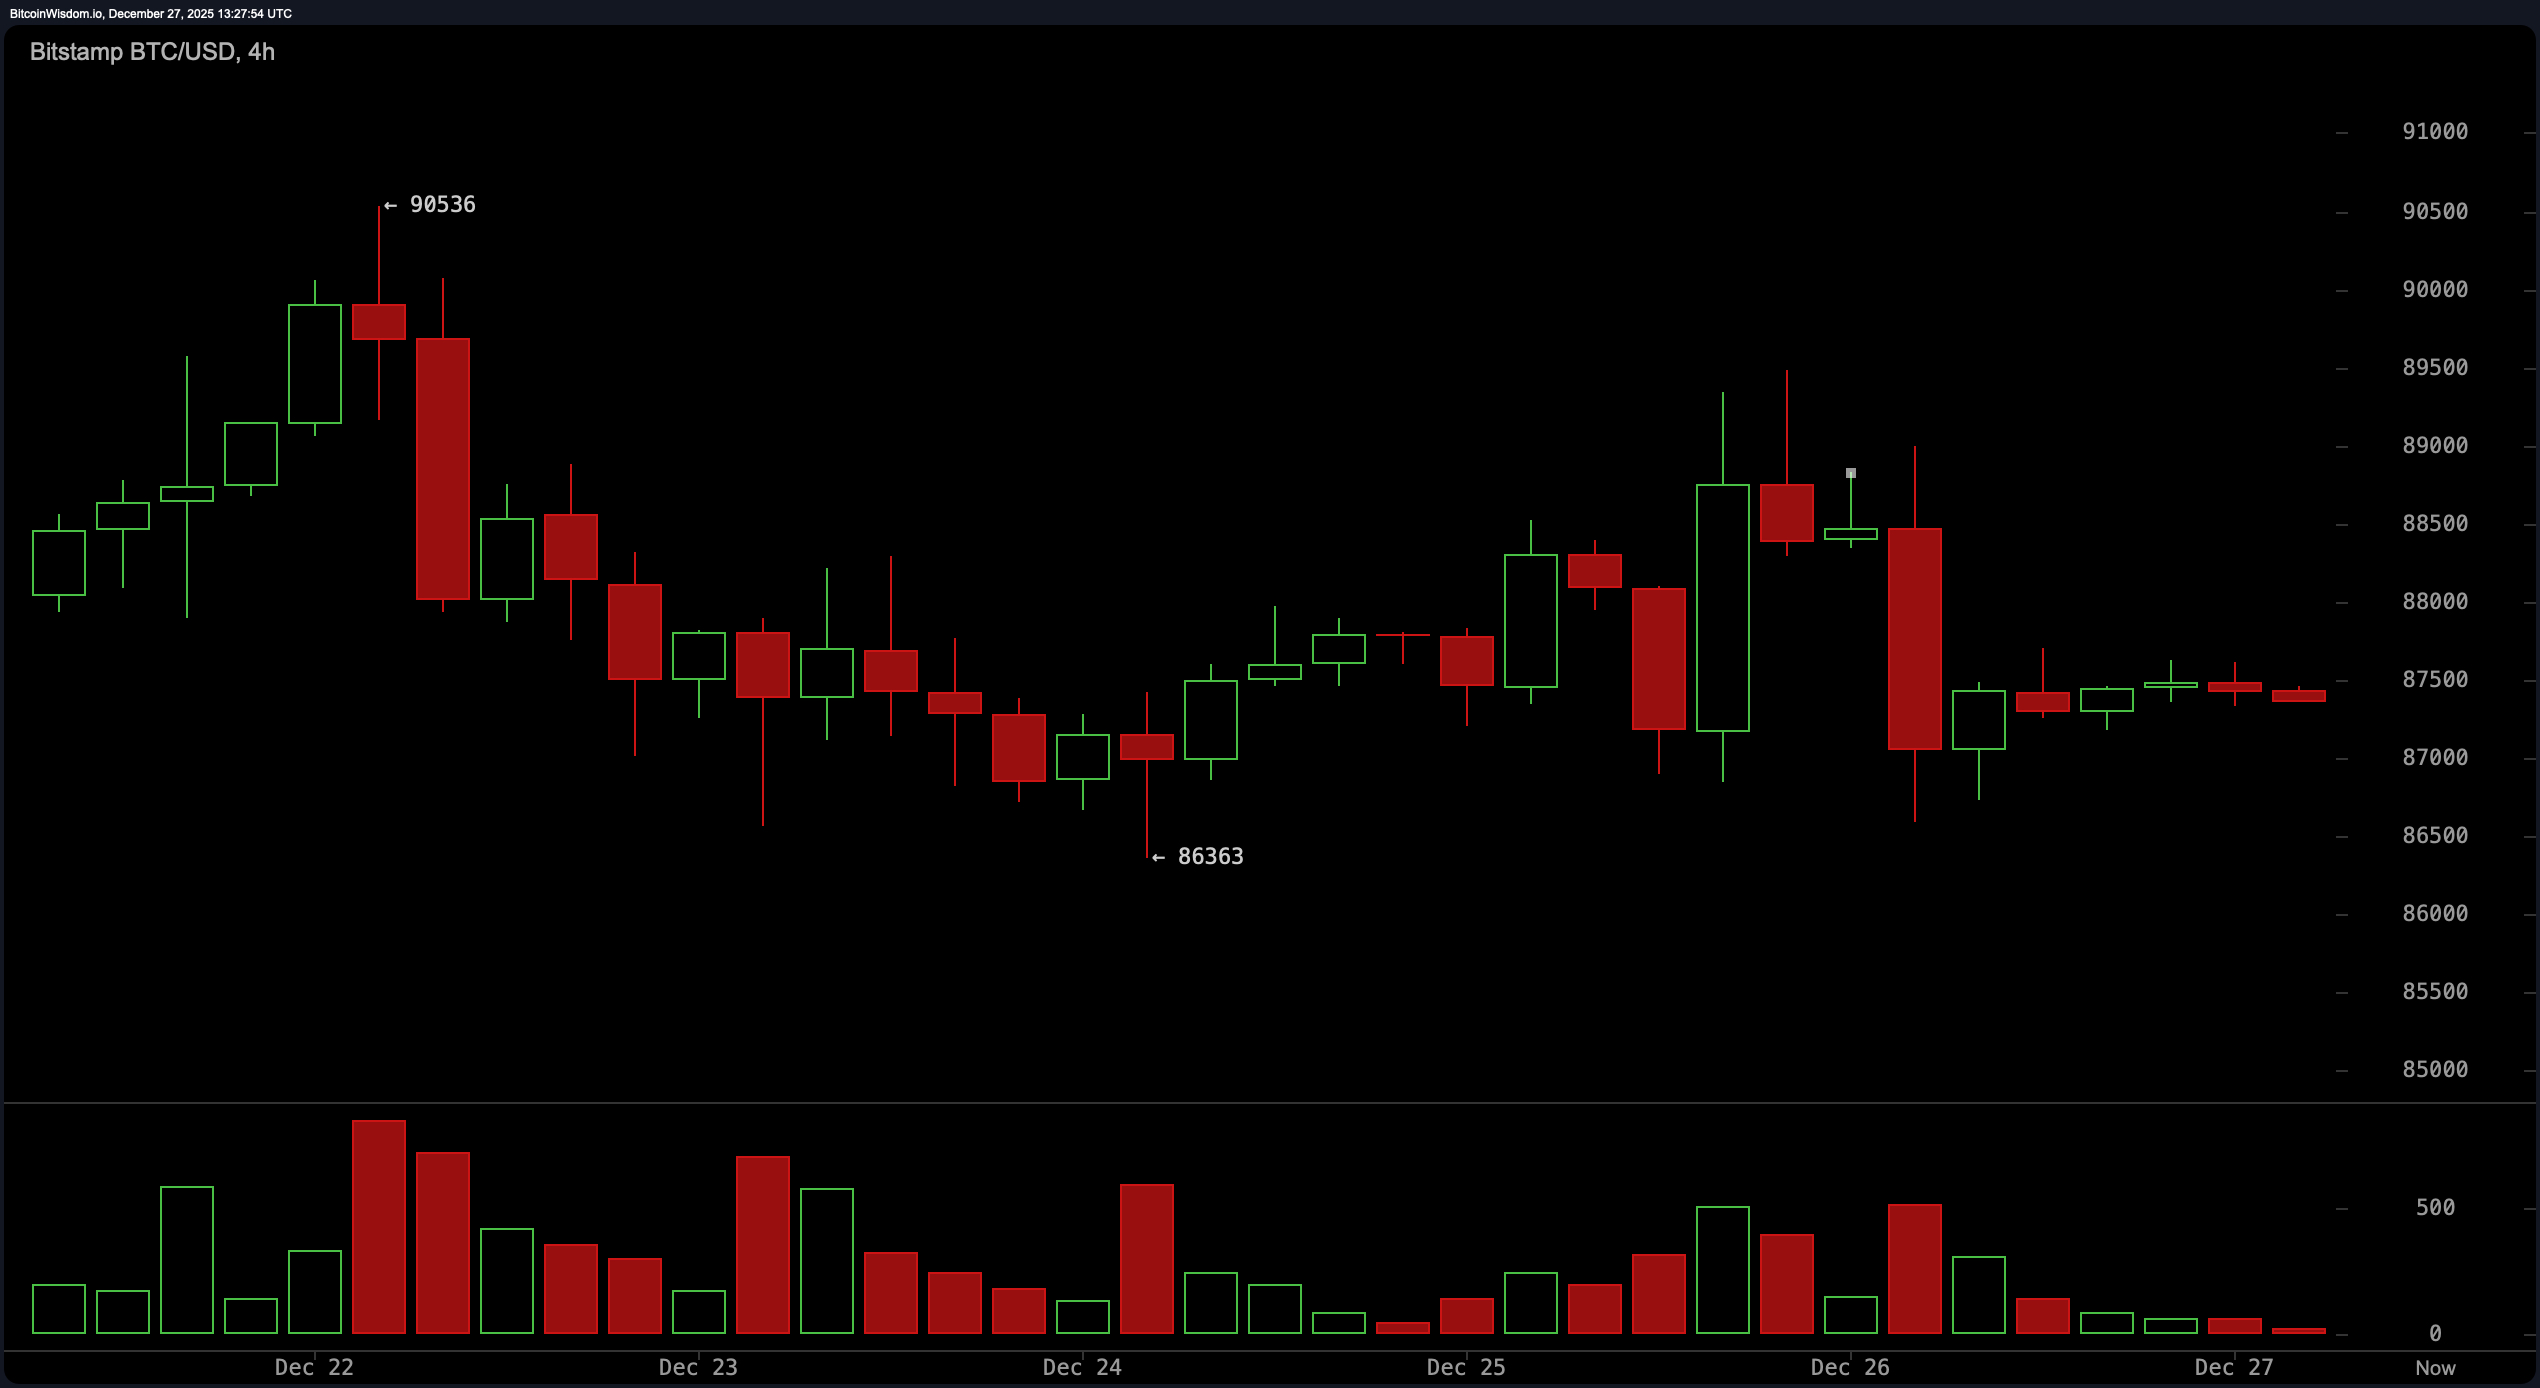
The four-hour chart paints a slightly more pessimistic picture. The rejection at roughly $90,536 was sharp and decisive—accompanied by multiple red candles indicating strong selling pressure—suggesting many traders opted out of pushing prices higher during this rally attempt. Support around $86,363 has held firm so far like security guarding entry to an exclusive club at that price point but ongoing consolidation beneath resistance indicates sellers still hold sway in short-term action.
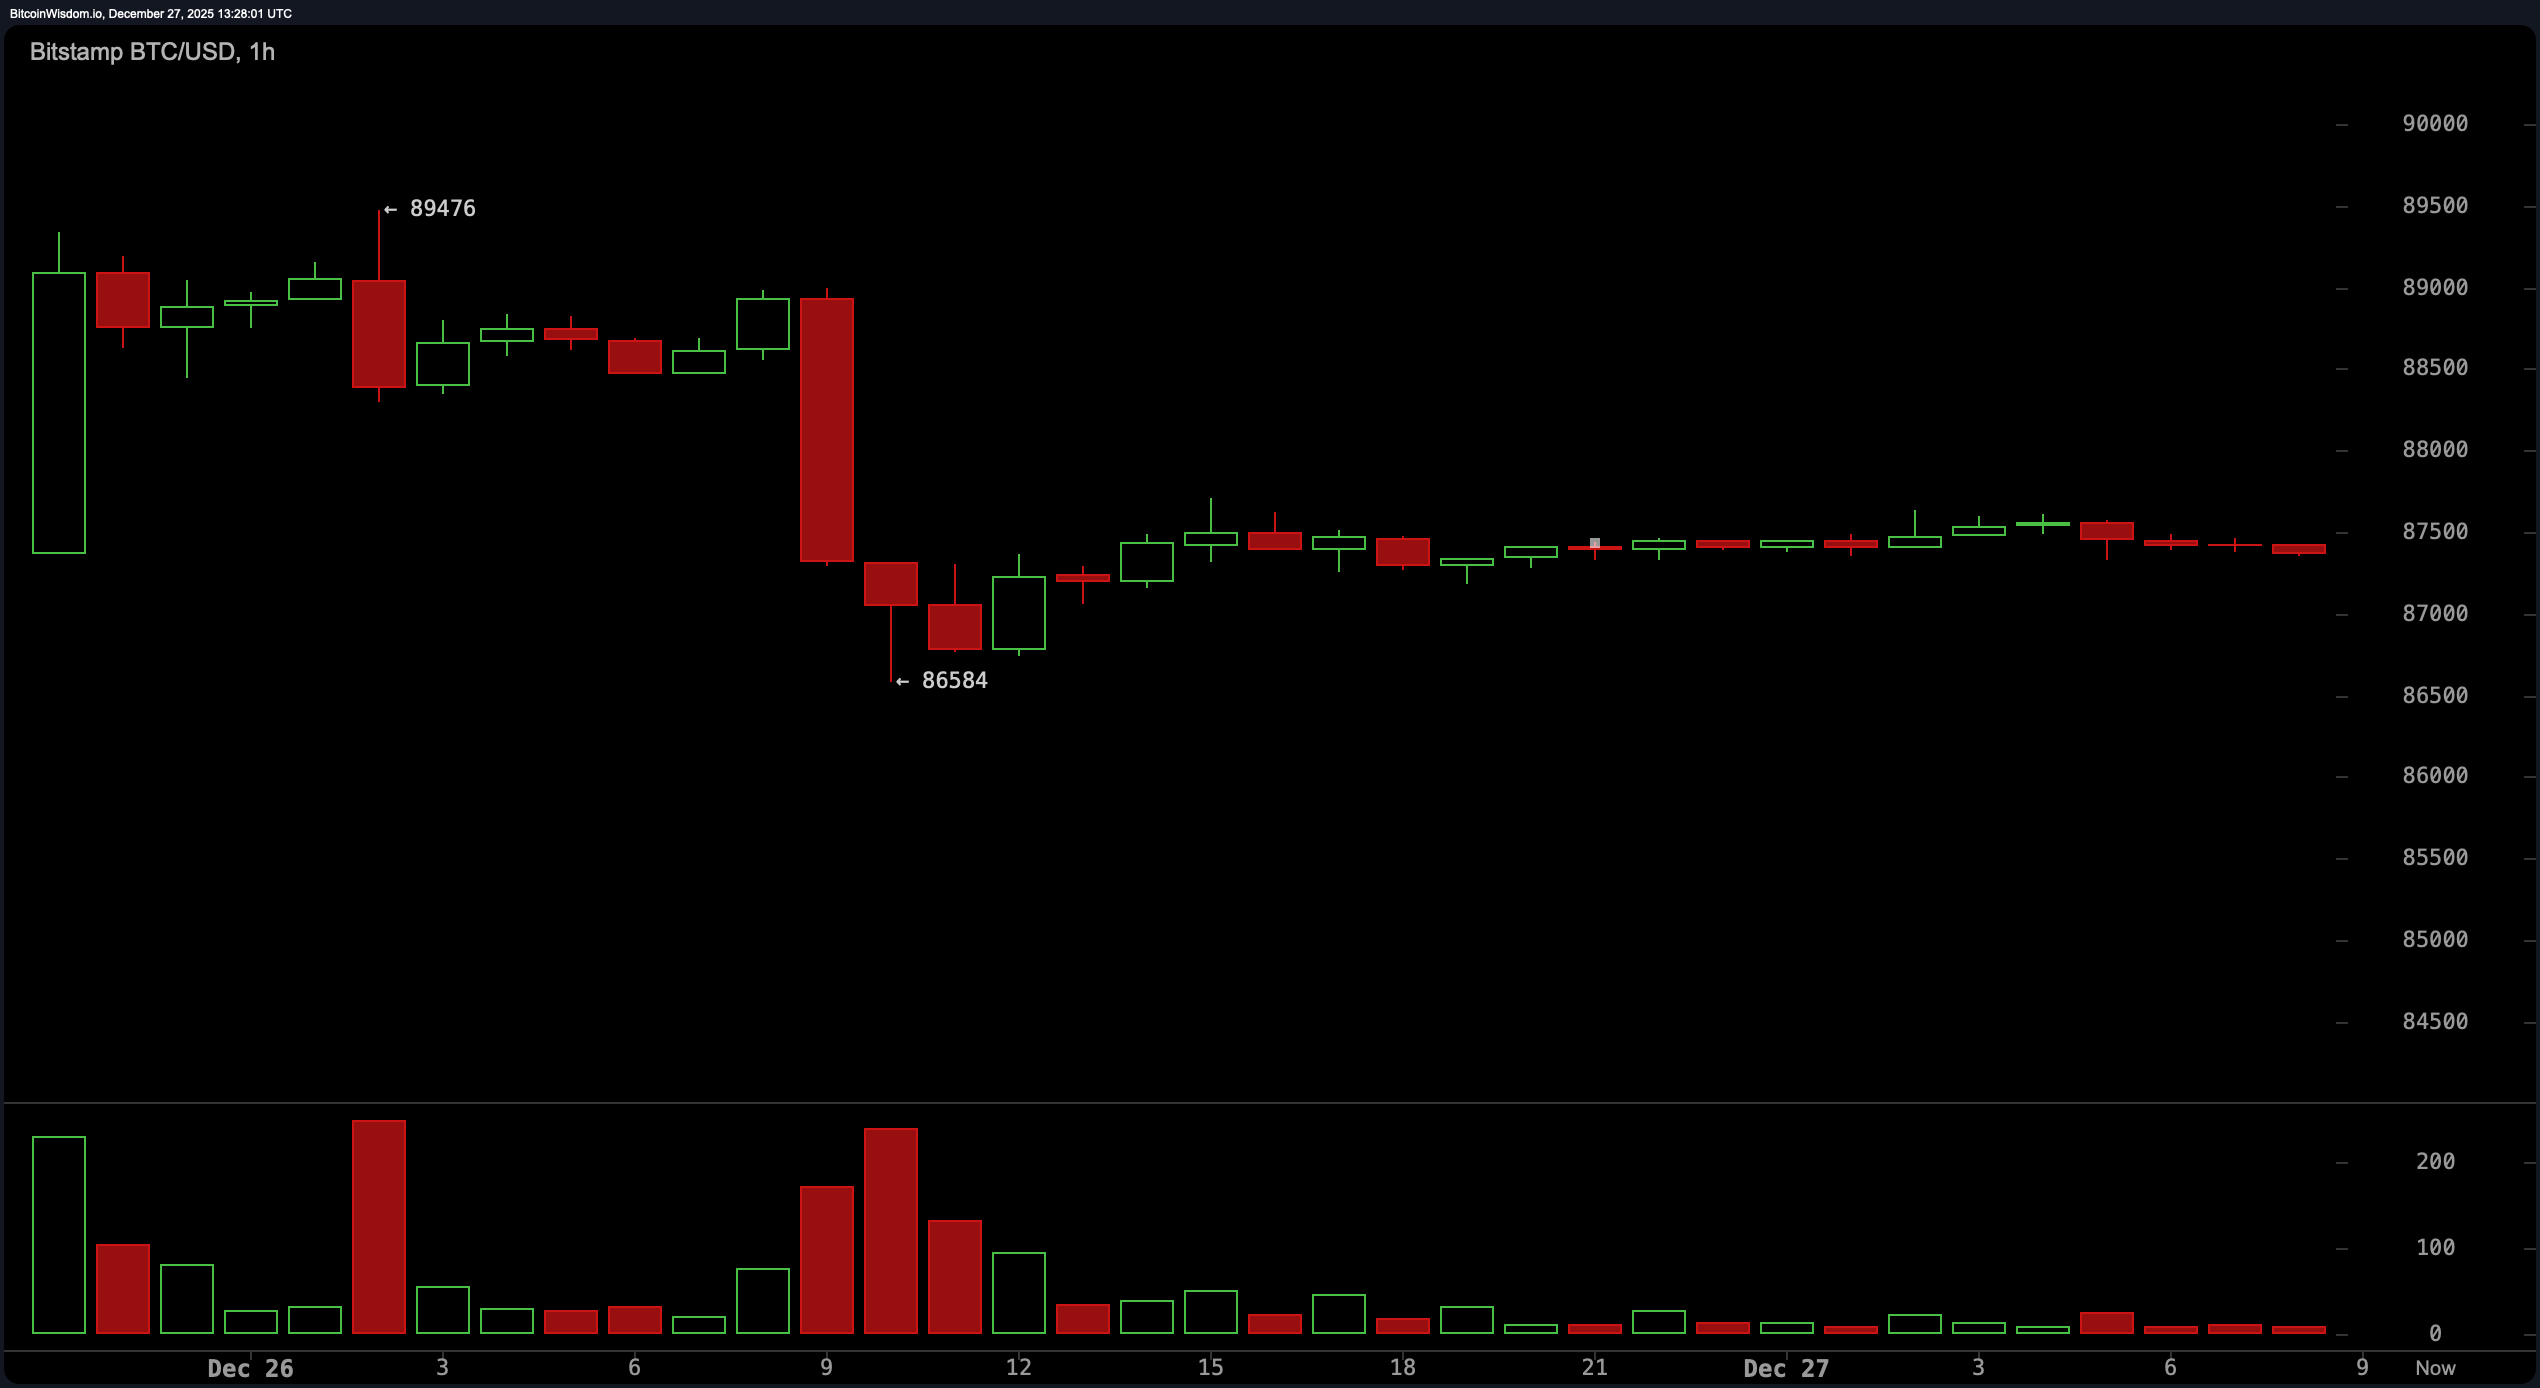
Diving deeper into hourly data shows even more uncertainty enveloping Bitcoin’s movements—a sudden plunge from about $89,400 down to near-$86,500 rattled sentiment briefly followed by sideways movement within tight bounds ($87K–$87.5K). Volume remains faint here as well—barely audible—which could either represent accumulation ahead of another upward push past ~$88K or serve as a deceptive bear flag warning of further declines if support near ~$86K fails.
Technical oscillators offer little clarity too — perfect for those who prefer ambiguity paired with prudence in their analysis! The Relative Strength Index (RSI), Stochastic oscillator,Ccommodity Channel Index (CCI), Average Directional Index (ADX),and Awesome Oscillator all hover neutrally without strong directional bias.
Only Momentum and Moving Average Convergence Divergence (MACD) show mild positive hints suggesting slight upward potential.
If this were any social gathering analogy,the latter two would be sipping espresso while others nurse plain water quietly awaiting next moves.
Regarding moving averages (MAs), skepticism reigns supreme across both short- &amp long-term metrics—from EMA10 through SMA200—all positioned above current pricing levels signaling bearish undertones.
It appears these averages collectively suggest Bitcoin needs some cooling off period.
Whether BTC manages to break through resistance spanning roughly from$88k up toward$88,&$500 will determine if it merely rests or gears up for another surge skyward.
Until then,traders should monitor volumes closely,respect volatility,and remember that true breakouts tend not announce themselves politely—they crash unexpectedly onto center stage!
Bullish Perspective:
A decisive move above$88,&$500 supported by significant trade volumes could pave way towards retesting upper resistance zones between$90k–91k.
With momentum(10) & <span>MACD indicators flashing green amid otherwise neutral readings,a narrow window opens favoring upside continuation.
This scenario depends less on raw strength but more on timing precision combined with trader conviction levels.
Bearish Outlook:
If BTC fails maintaining support around$86k,it risks confirming bearish patterns visible especially on hourly charts such as bear flags which target lower ranges near approximately$83,&$500–84k zone.
The overwhelming presence of moving averages stacked overhead plus stronger sell-volume compared against weaker rallies suggests downside pressure remains dominant.
Though bears may not roar loudly just yet,their circling presence warns caution among bulls.
Frequently Asked Questions ❓
What is bitcoin’s current price?
Bitcoin trades at about $87,&,382 (as recorded Dec 27th ,2025).
Is bitcoin trending upwards or downwards right now?
Currently,it’s consolidating within narrow boundaries showing mixed technical signals making direction uncertain.
What key levels should traders watch ?
Resistance lies close around $88 ,& amp ; # 820 ; 500 while support holds roughly near $86 ,& amp ; # 820 ; 000 .
Why is today ’ s trading volume low ?
Due mainly due holiday season effects,this subdued activity reflects typical market indecision or possibly sets stage ahead larger move .