
This Christmas, the leading cryptocurrency decided to take a break by the fire, maintaining its position at $87,489 with less excitement than a typical family gathering. Despite the festive decorations and lights, Bitcoin spent the day hovering near its lower intraday limits, exhibiting more caution than celebration.
Bitcoin Chart Analysis
On the daily chart, Bitcoin is still processing its recent peaks after experiencing a significant drop from $94,652. The price has settled around a repeatedly tested support level between $86,000 and $87,000 for now.
However, there’s an evident lack of conviction in trading patterns—characterized by small candle bodies and Doji formations—which indicates uncertainty. Although technically corrective following an upward trend remains in play; it’s not time to celebrate just yet as momentum appears weak and bulls have yet to make a decisive comeback.
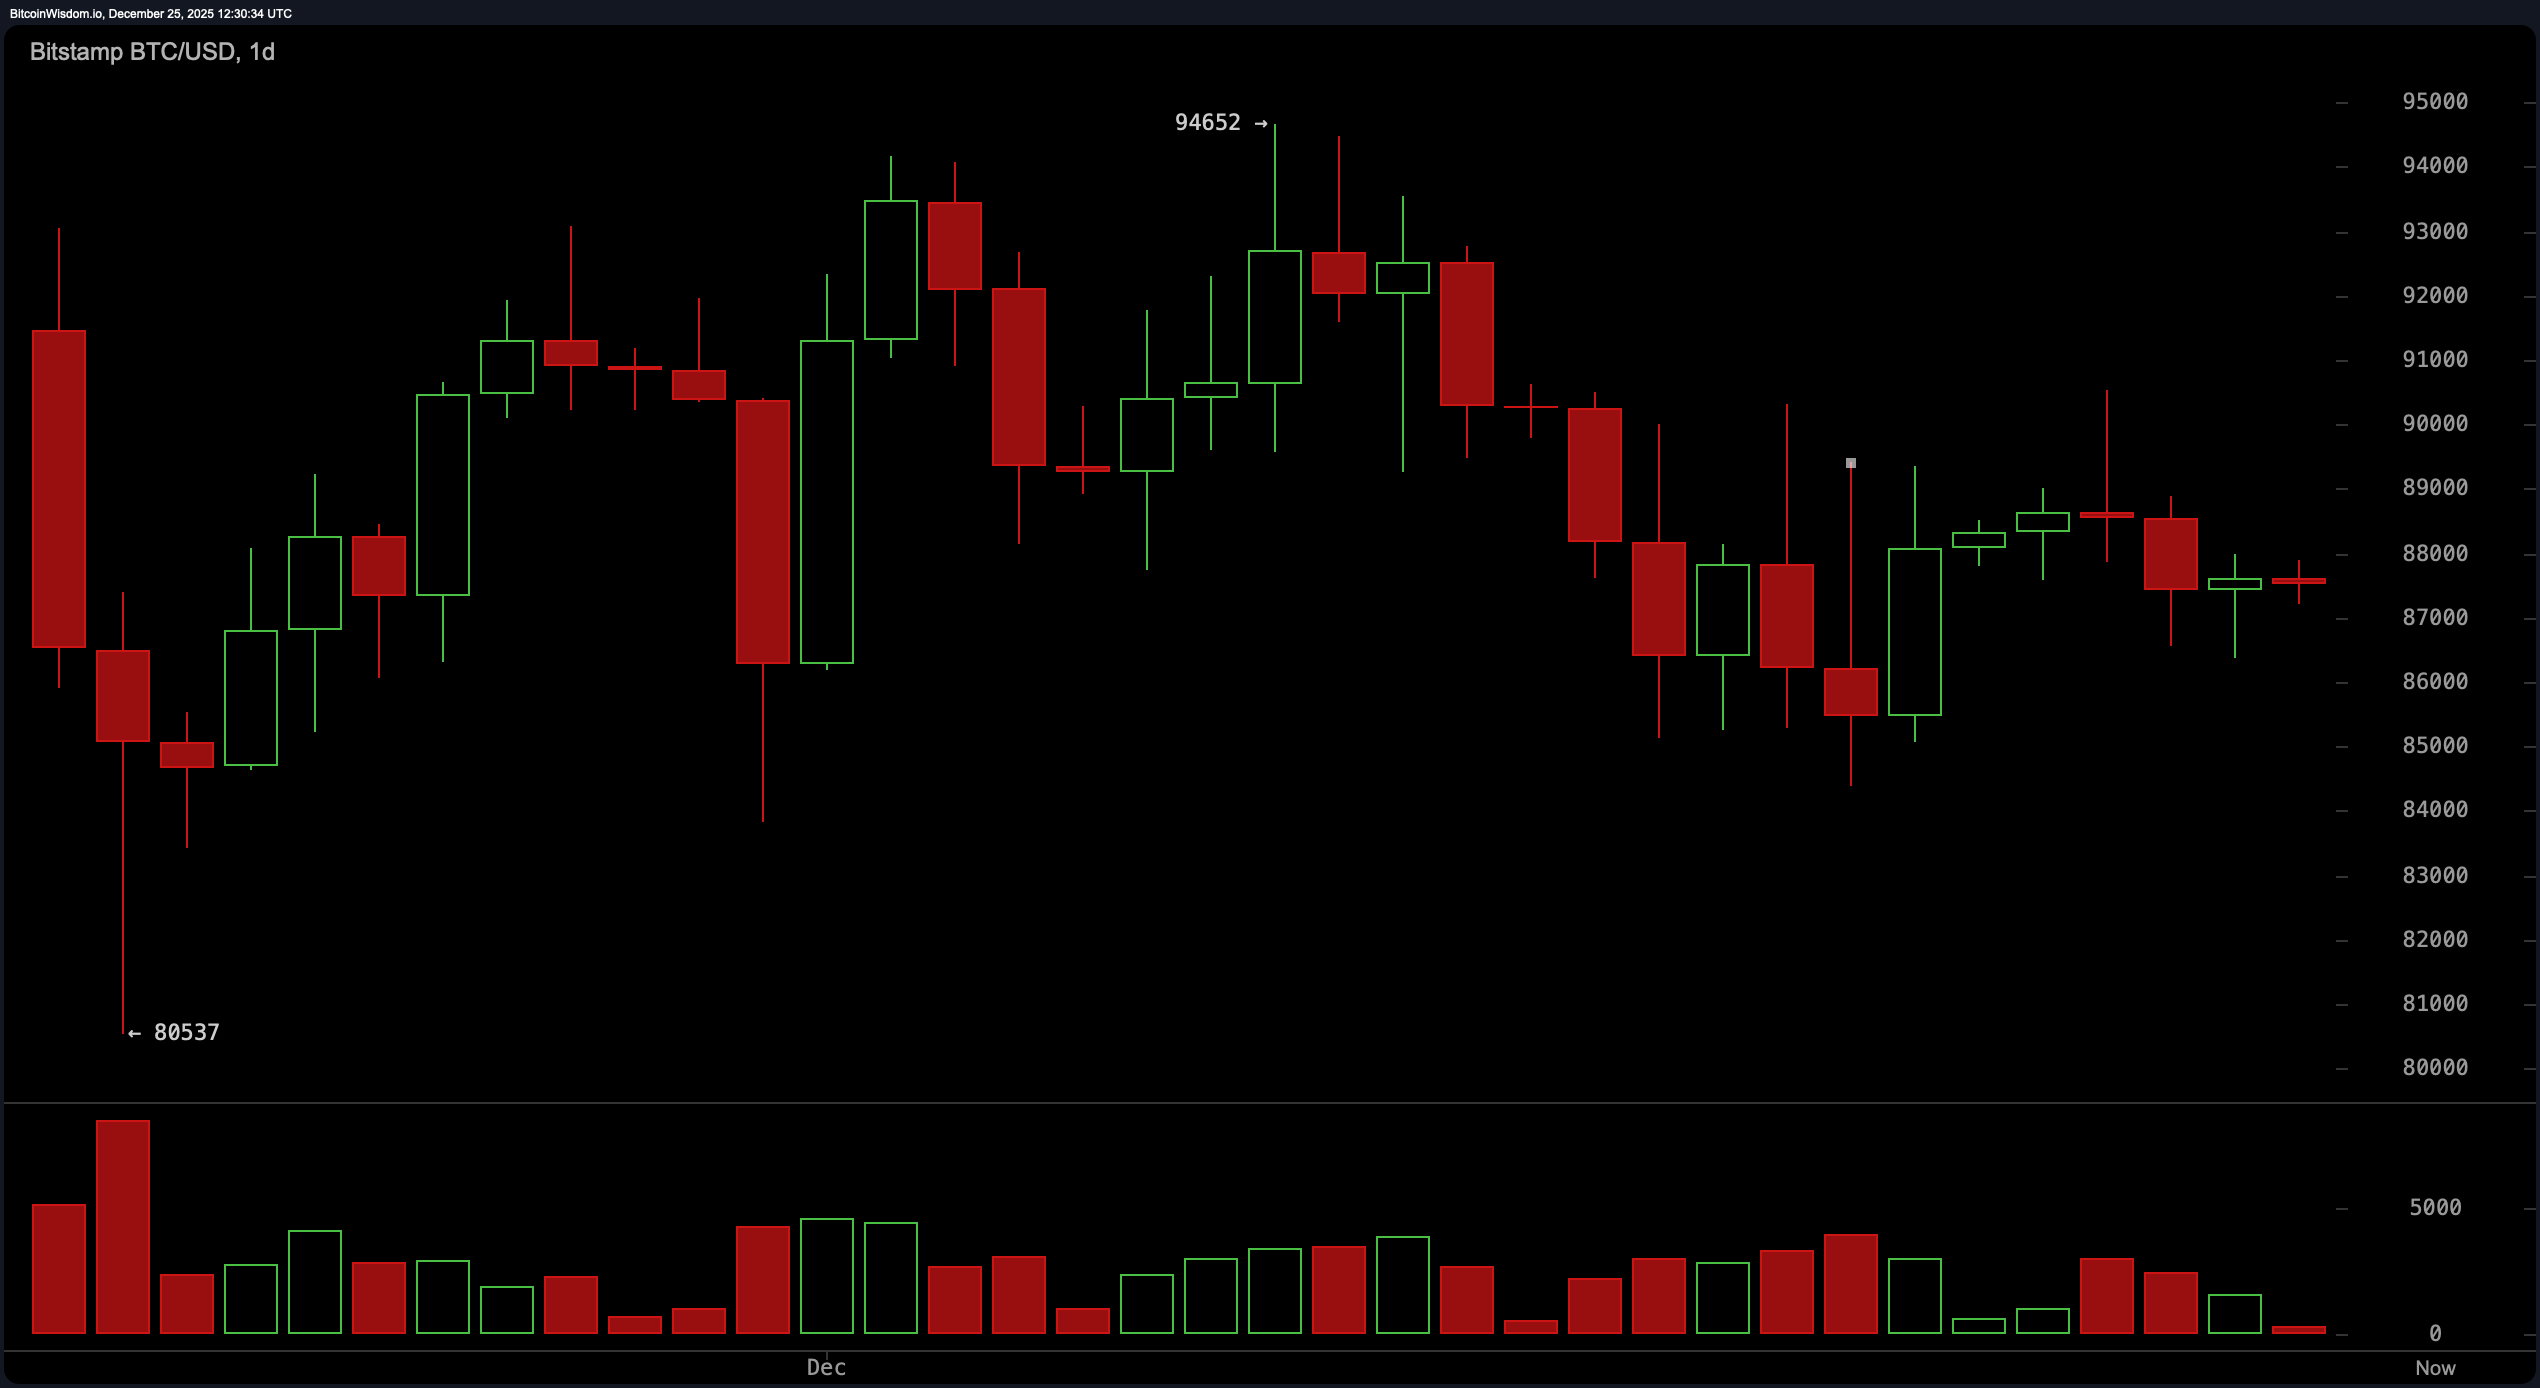
BTC/USD 1-day chart via Bitstamp on Dec. 25, 2025.
The 4-hour chart reflects this period of consolidation. After successfully testing at $86,363 once again, Bitcoin edged upwards towards $88,000; however trading volume has dropped significantly like interest in holiday fruitcake. A breakout above $88,800 continues to elude traders; without it this sideways movement becomes merely waiting game for market participants who may be enjoying cocoa on the sidelines while hoping for increased volume that could validate any directional bias.
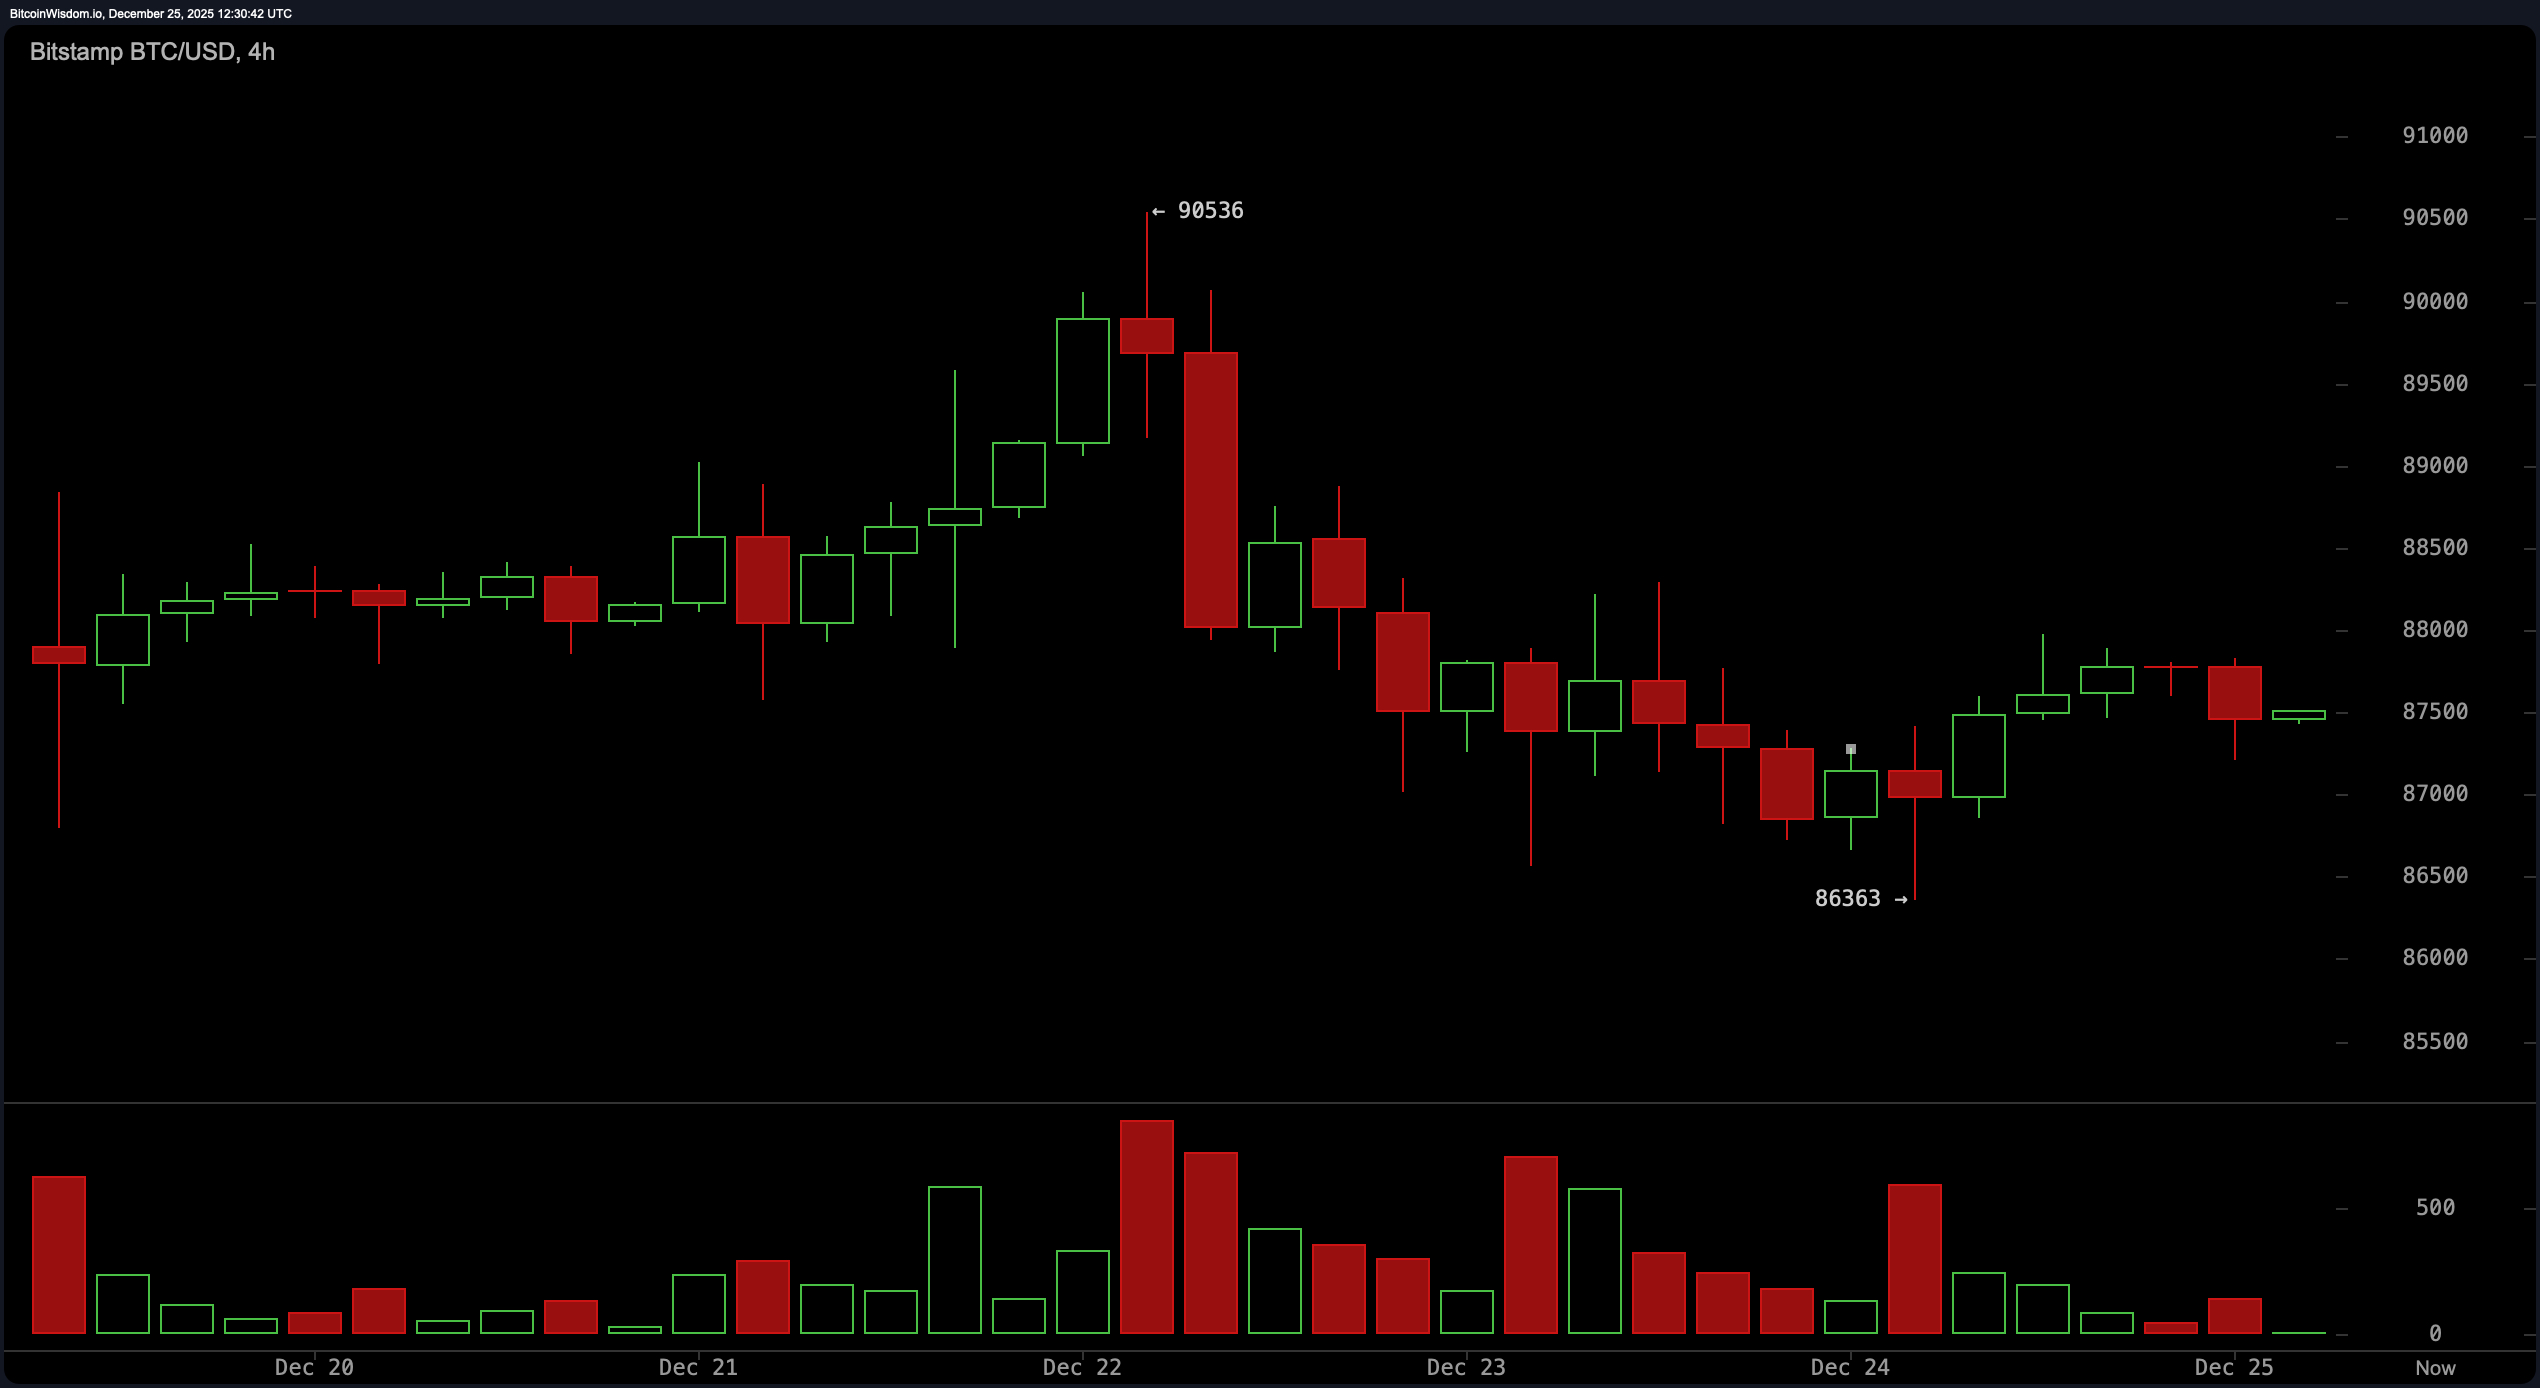
BTC/USD 4-hour chart via Bitstamp on Dec. 25,2025.
Diving into the hourly chart reveals that Bitcoin’s microtrend is oscillating between bearishness and neutrality. A recent bounce from $86,363 up to a local peak of $87,976 has faded into a narrow range between approximately $87,300 and $87,800 with trading volumes thinner than holiday eggnog; short-term traders seem worn out leaving Bitcoin stuck in limbo . A definitive move above $88,000 might signal bullish intent while dropping below $87,000 could unravel support faster than wrapping paper on Christmas morning.
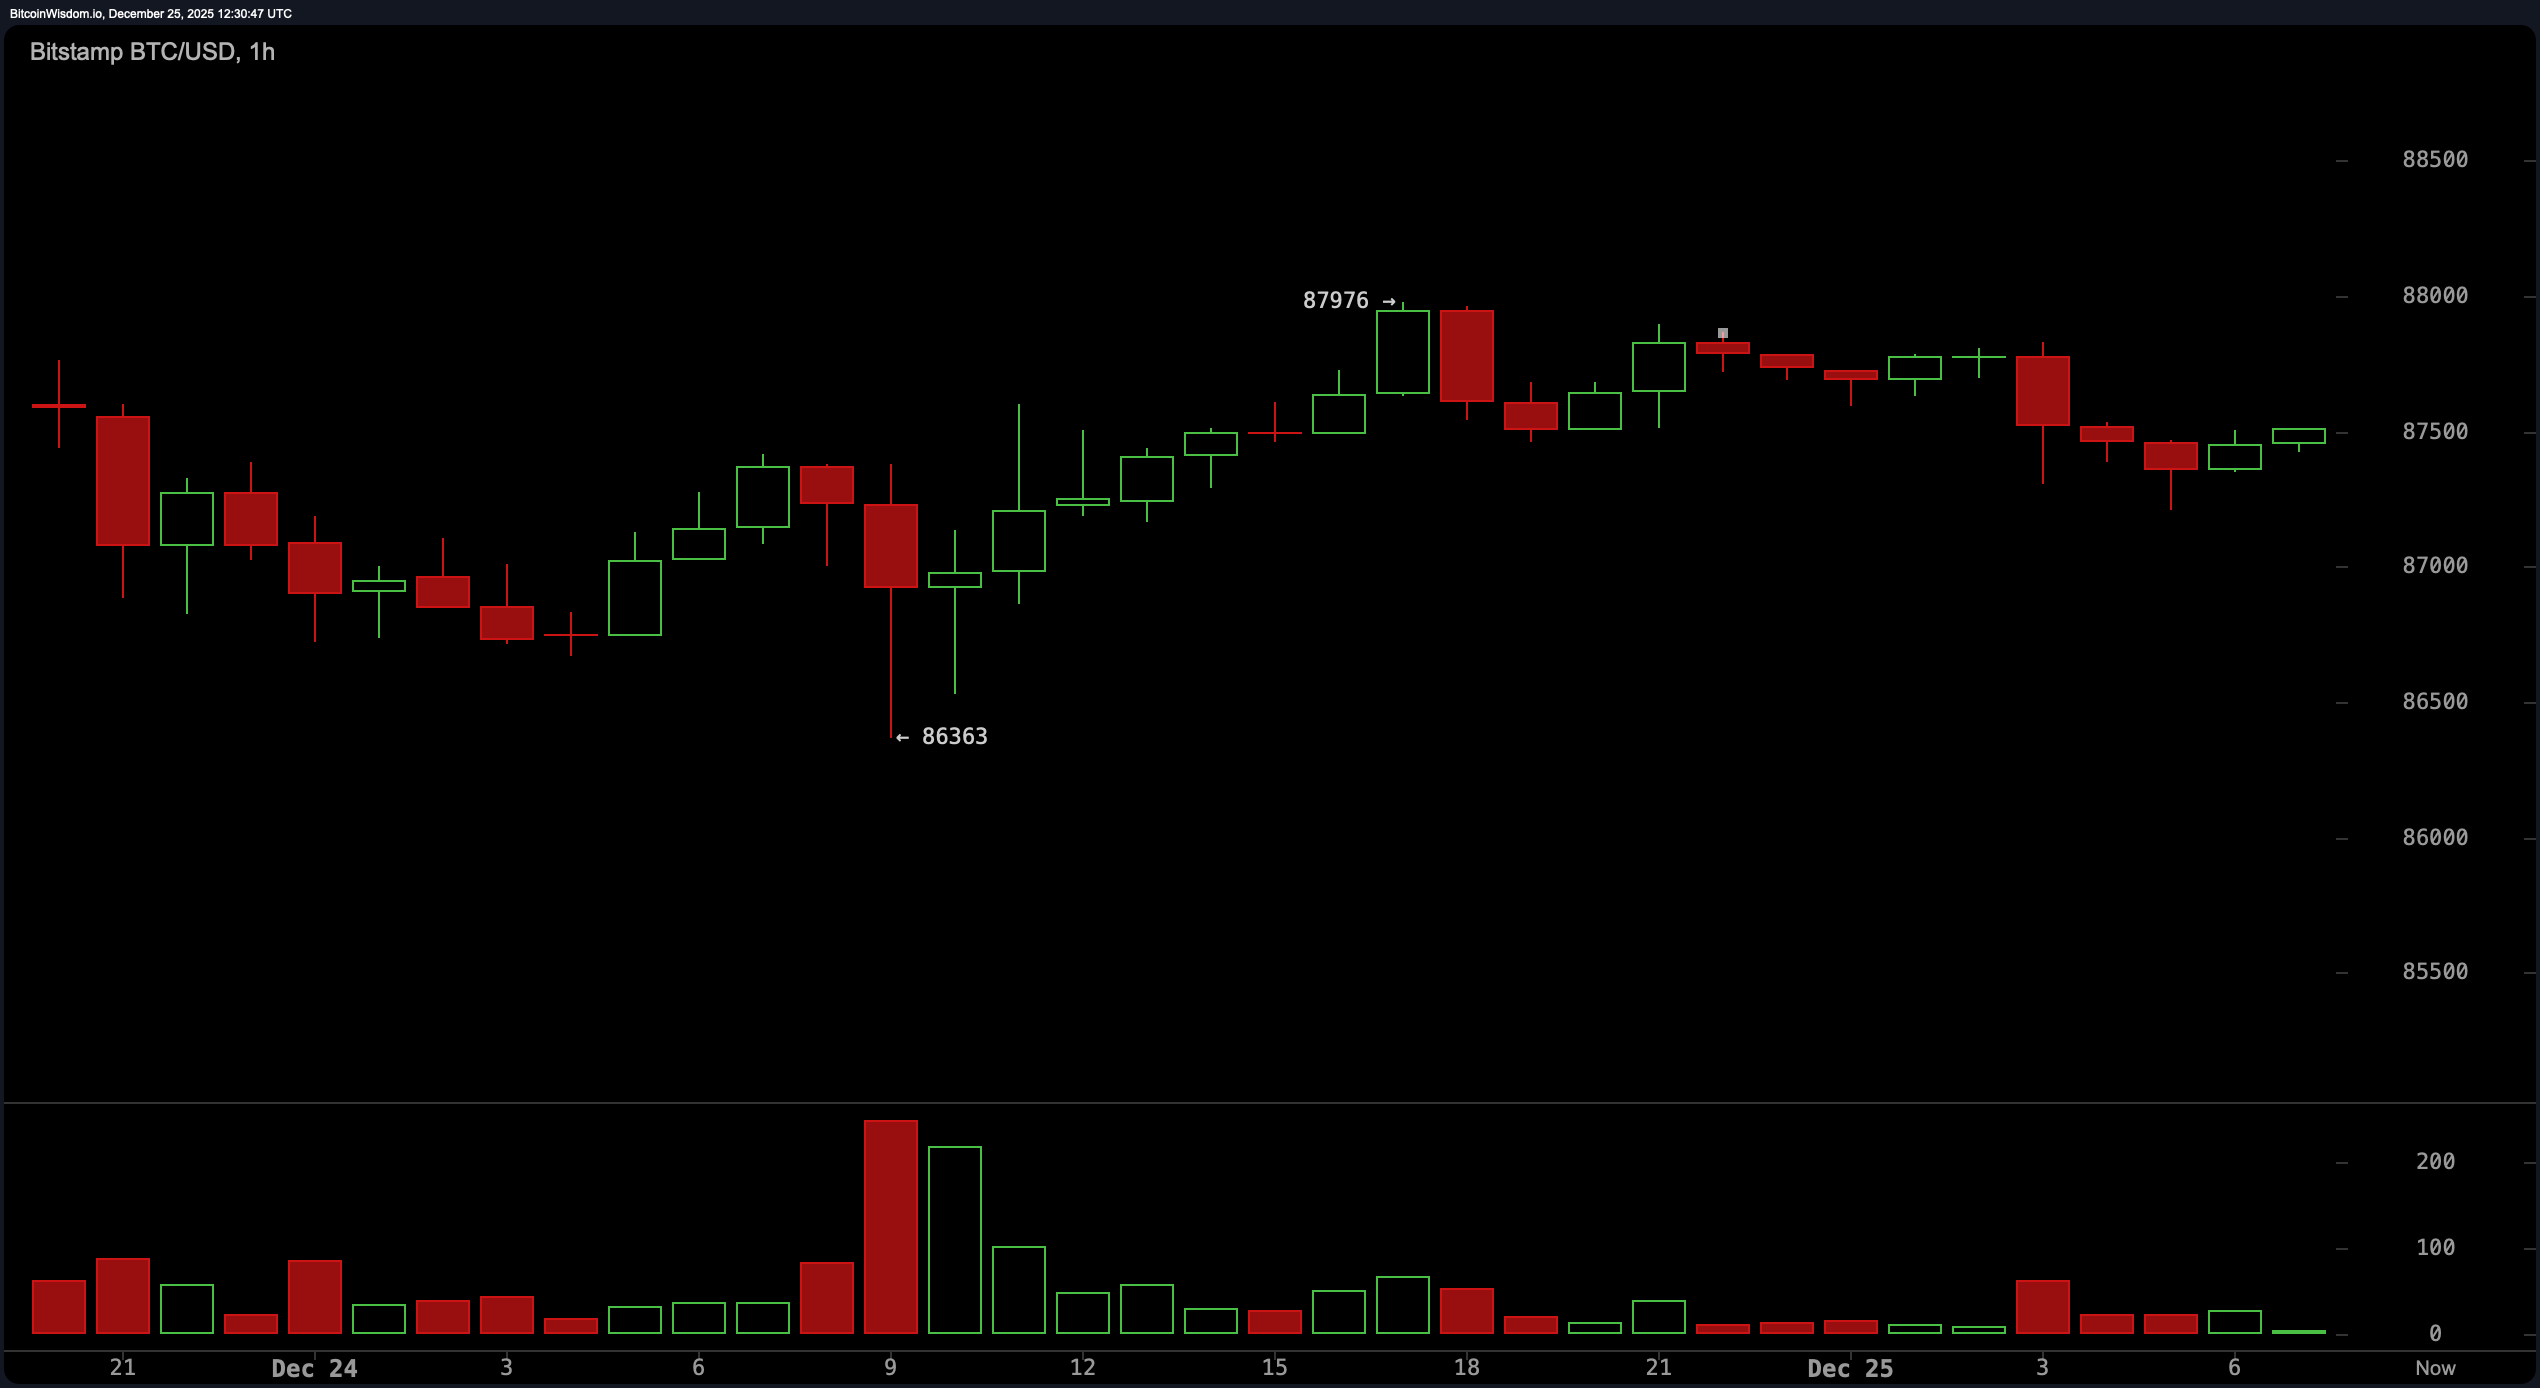
BTC/USD 1-hour chart via Bitstamp on Dec.25 ,2025.
The oscillators are also not providing much guidance for decision-making during this festive season either . The relative strength index (RSI) sits at 43 ,the stochastic oscillator reads 34 ,and commodity channel index (CCI) shows -62—all suggesting neutrality . Meanwhile average directional index (ADX) stands at 23 indicating weak trend strength .The awesome oscillator is negative at -1182 ;momentum slightly positive reading 1096 ;and moving average convergence divergence (MACD ) hints bullish divergence sitting at -1327 So yes there’s some glimmer beneath surface even if it isn’t shining brightly just yet
Moving averages (MAs), however cast shadows over bitcoin’s sleigh ride every major exponential moving average(EMA )and simple moving average(SMA )from ten-period through two-hundred period hover above current prices—a clear bearish setup.The ten-period EMA rests around $87962,and things only get chillier from here—the two-hundred period SMA looms far higher up close-to $107611 Until these MAs shift downwards or prices break past them bitcoin’s short-term fate may remain tethered within established base support zones
In conclusion,both price action & low-volume dynamics indicate that bitcoin finds itself caught between competing forces—either breaking through resistance levels or slipping back down again will depend less upon jingle bells & more upon sustained volume coupled alongside macro sentiment.For now,traders should keep one eye glued onto charts—and another eye fixated firmly onto their seasonal treats.
Bullish Perspective:
If bitcoin manages convincingly reclaiming levels around $88000 closing above said threshold either within four hour/daily charts—it could spark renewed momentum pushing towards ranges spanning anywhere from $90000-93000.A bounce occurring off supportive zones ranging across$86000-87000 bolstered by rising volumes along shifts seen amongst oscillators would confirm readiness among bulls eager resume festivities associated rally.
Bearish Perspective:
Conversely should bitcoins falter below critical supports positioned near$86000 next likely target rests set against$84000 potentially leading deeper declines heading toward$80500 With all major MAs stacked overhead alongside mostly neutral-negative indicators bears stand poised ready drag sentiments further downward provided weakness persists
Frequently Asked Questions 🎄
Where is bitcoin currently trading?Bitcoin hovers around $87489 displaying tight price movements near key supports
Is sentiment surrounding bitcoins leaning bullish/bearish presently?Momentum feels mixed though overall indicators appear cautiously leaning bearish across varying timeframes
What pivotal pricing thresholds exist ahead concerning bitcoins trajectory? Support lies positioned roughly within$8600087000 meanwhile resistances form closer towards$8800091000
Why does current week see diminished activity regarding bitcoins trade volumes? Seasonal slowdowns paired lack significant macro catalysts lead traders remaining hesitant engaging actively