Today, Bitcoin is priced at $78,162, boasting a market cap of $1.56 trillion and experiencing a 24-hour trading volume surge to $54.86 billion. Over the past day, its value has fluctuated narrowly between $77,642 and $79,130—tight ranges that mask an underlying indecisiveness in the market.
Bitcoin Market Analysis
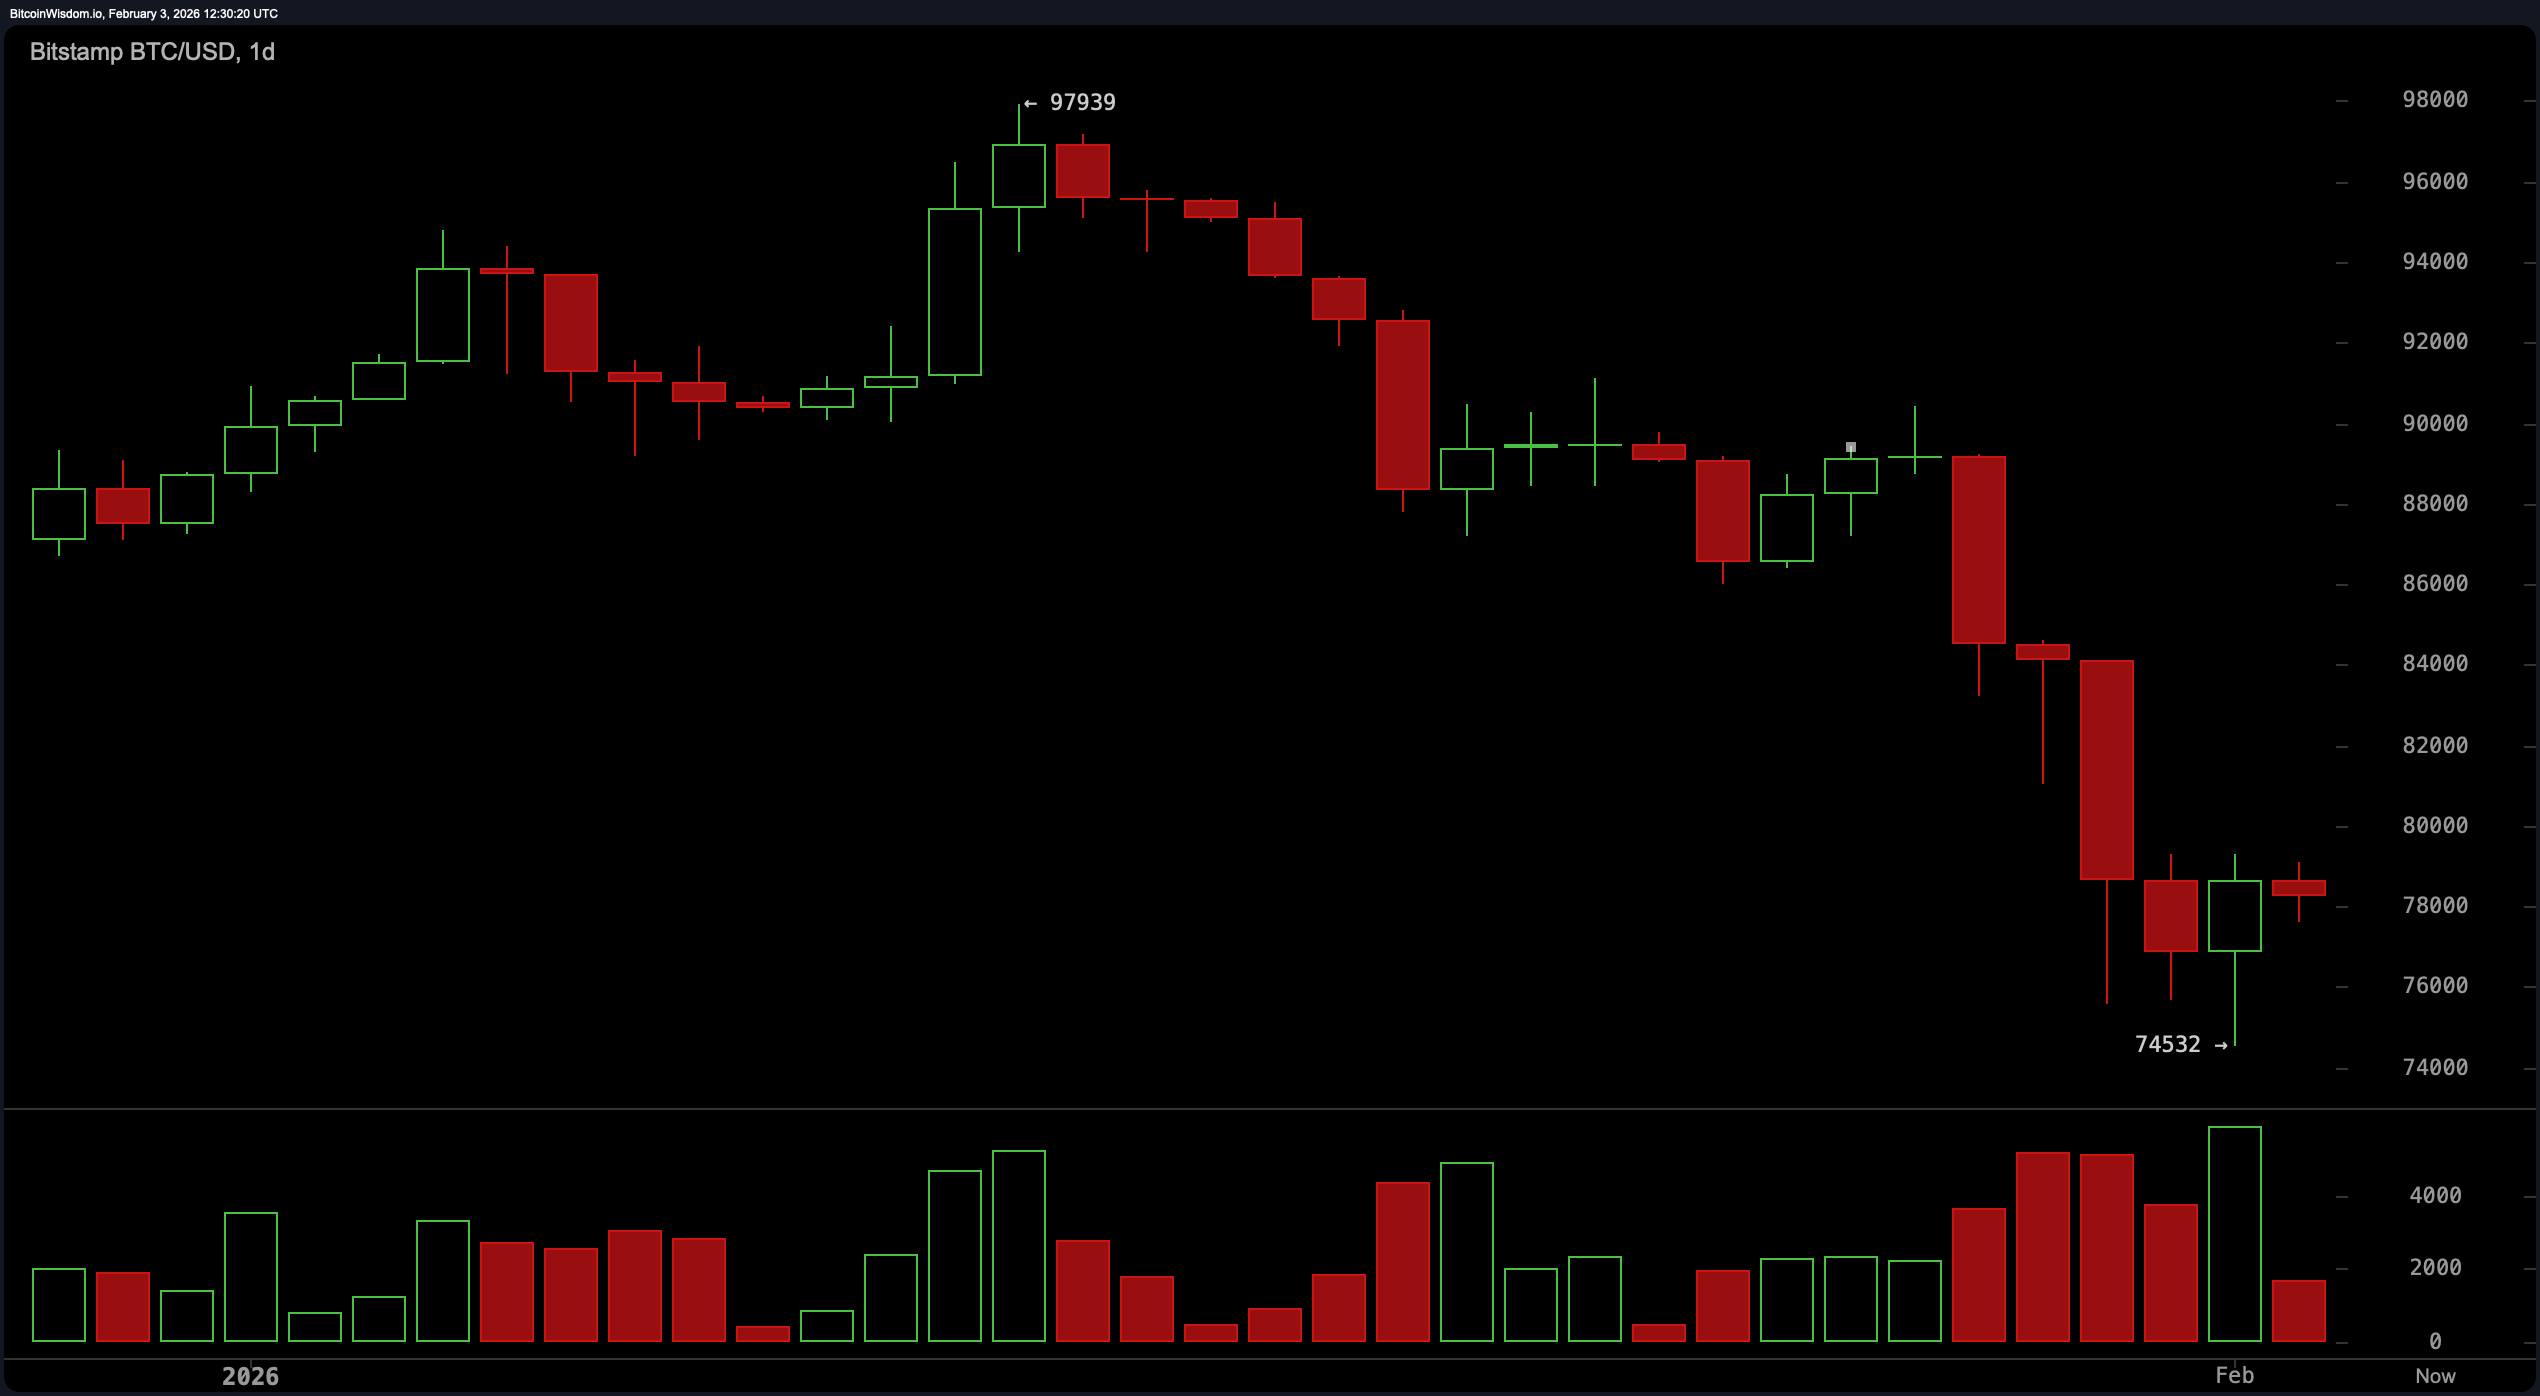
The daily chart shows Bitcoin still recovering from its sharp drop from nearly $97,900 down to a low of around $74,532. This rebound hasn’t been strong or confident; rather it resembles cautious steps forward instead of a robust rally.
The price action looks more like a corrective phase than an impulsive advance. Bulls seem hesitant rather than assertive as resistance remains firmly entrenched between the $88,000 and $90,000 zones. Meanwhile, support levels near $74,500 to $76,000 provide psychological comfort for traders. Without reclaiming above the critical threshold of $90K with conviction and momentum, the overall sentiment stays neutral to bearish.
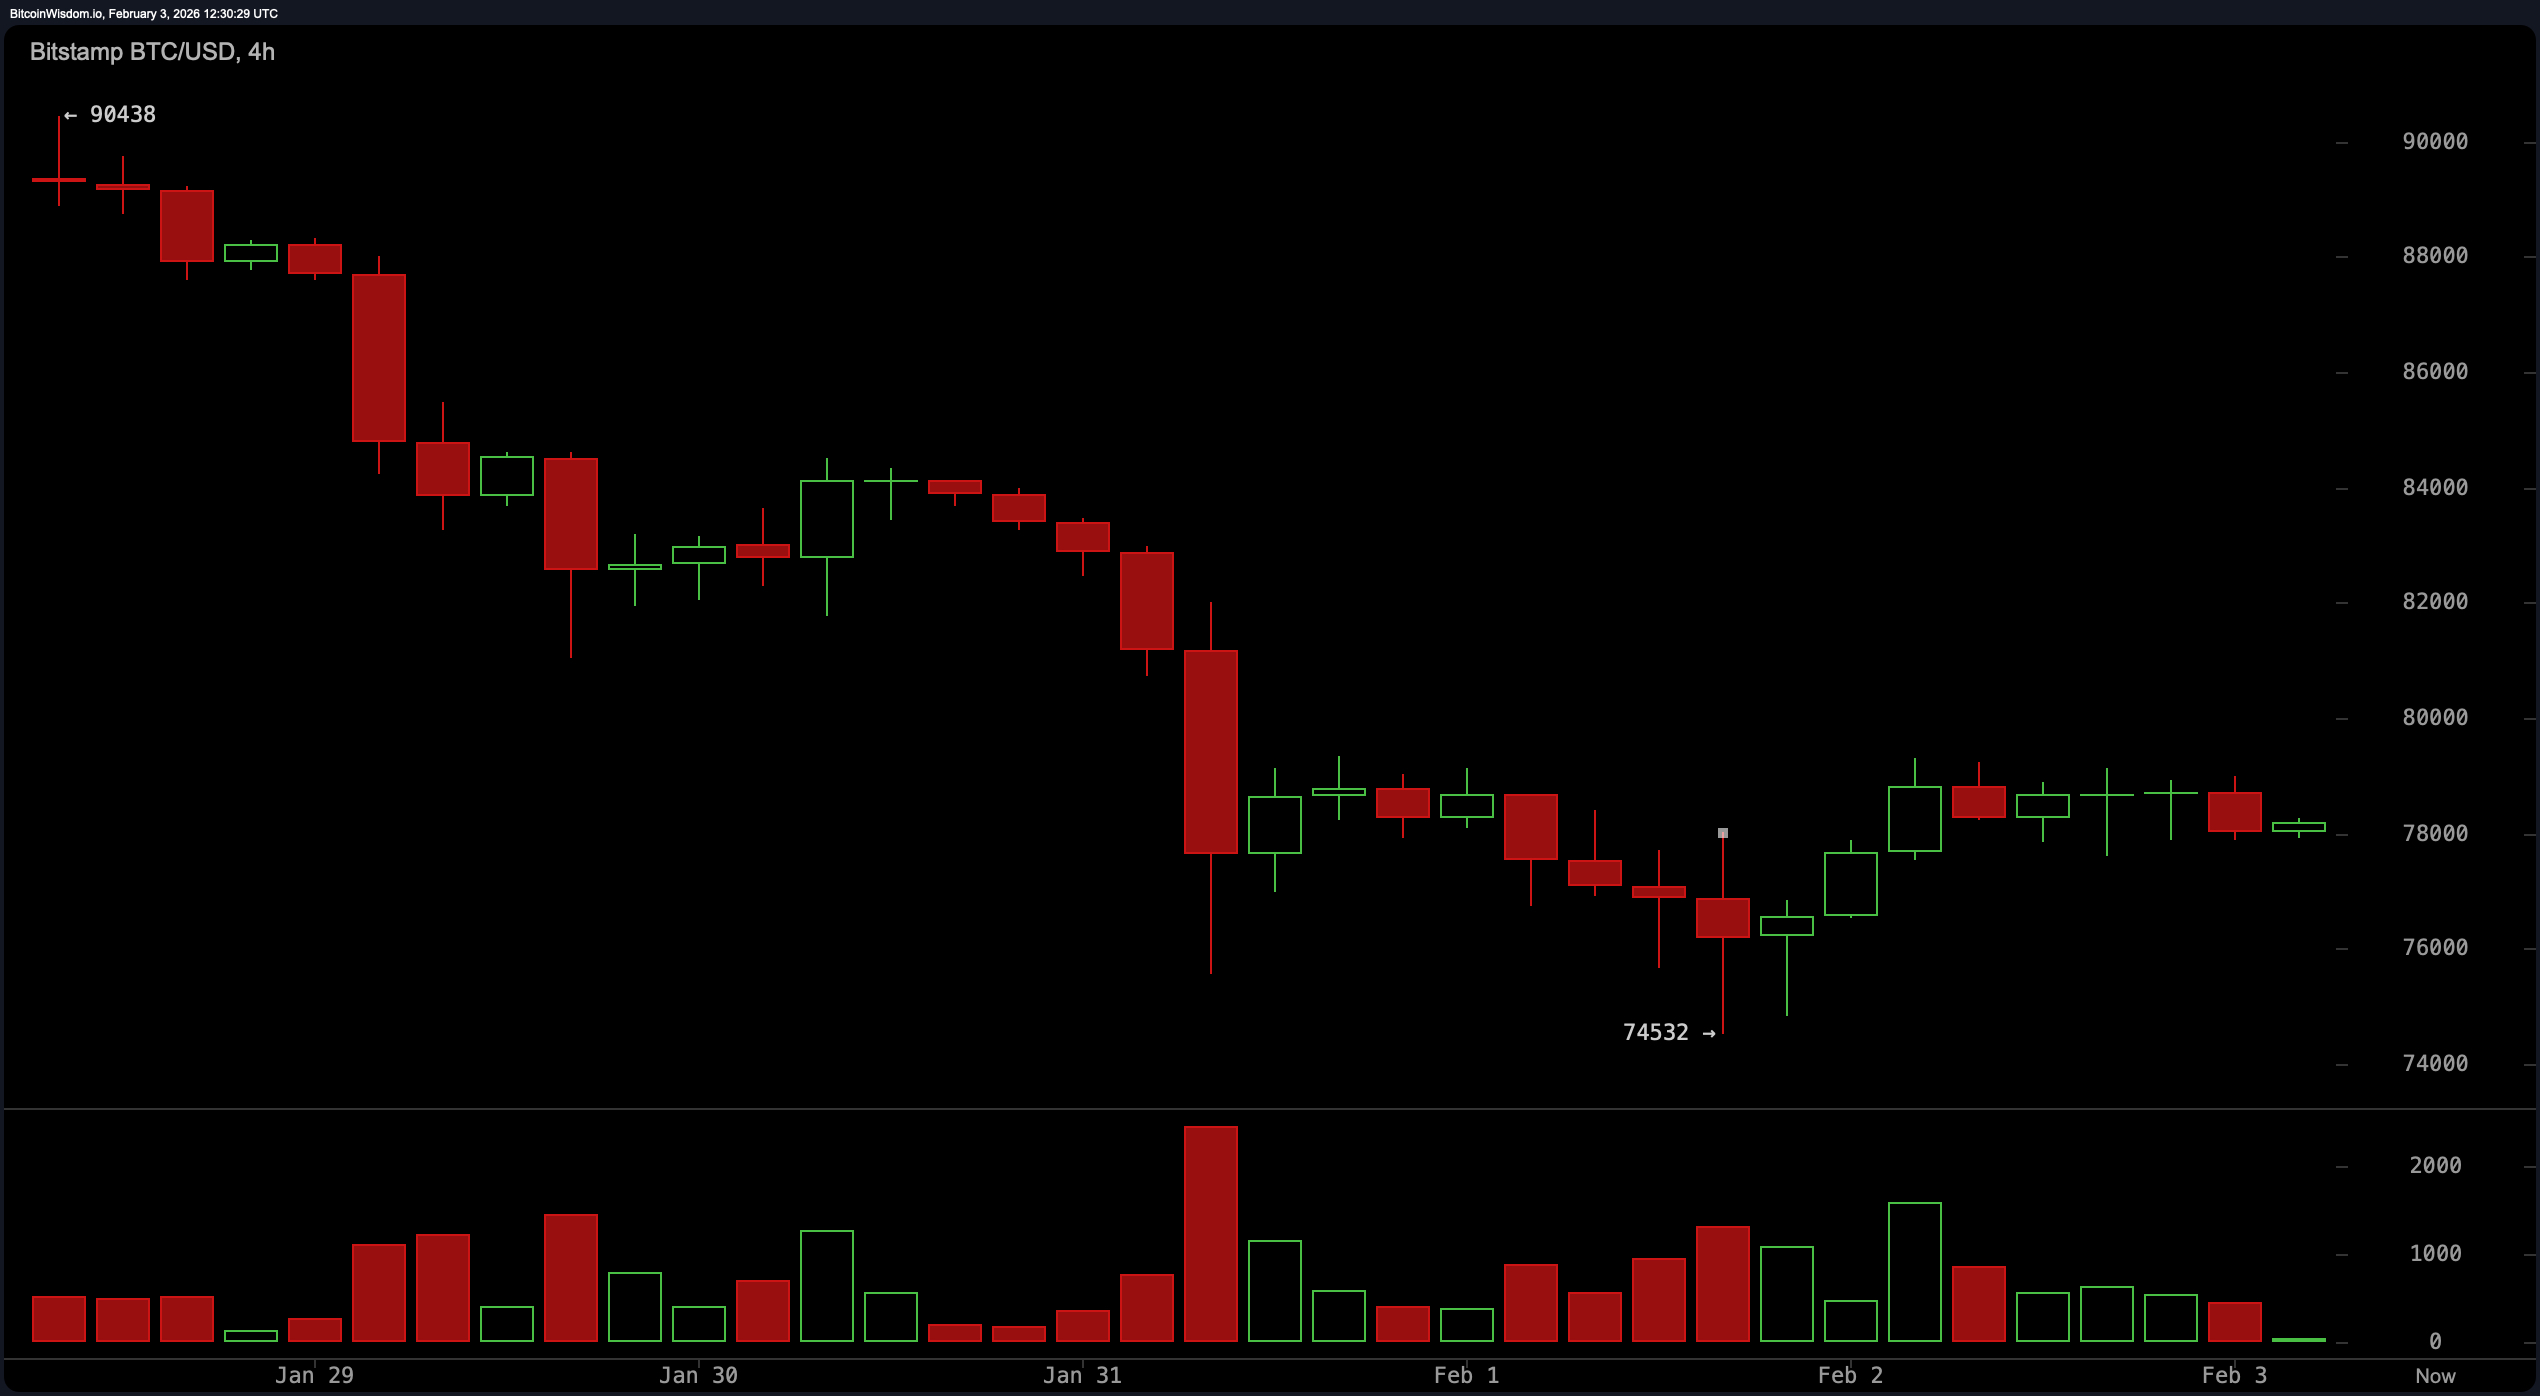
Examining the 4-hour timeframe reveals ongoing drama but little decisive movement—lower highs persist indicating diminishing buyer enthusiasm. Price oscillates within a tight range from about $76K up to roughly $79.5K, suggesting traders are reluctant to commit fully. Volume patterns confirm this story: heavy selling pressure near lows followed by weak recovery attempts.
A breakout above $80K supported by strong volume could alter this mood significantly—but for now uncertainty dominates.
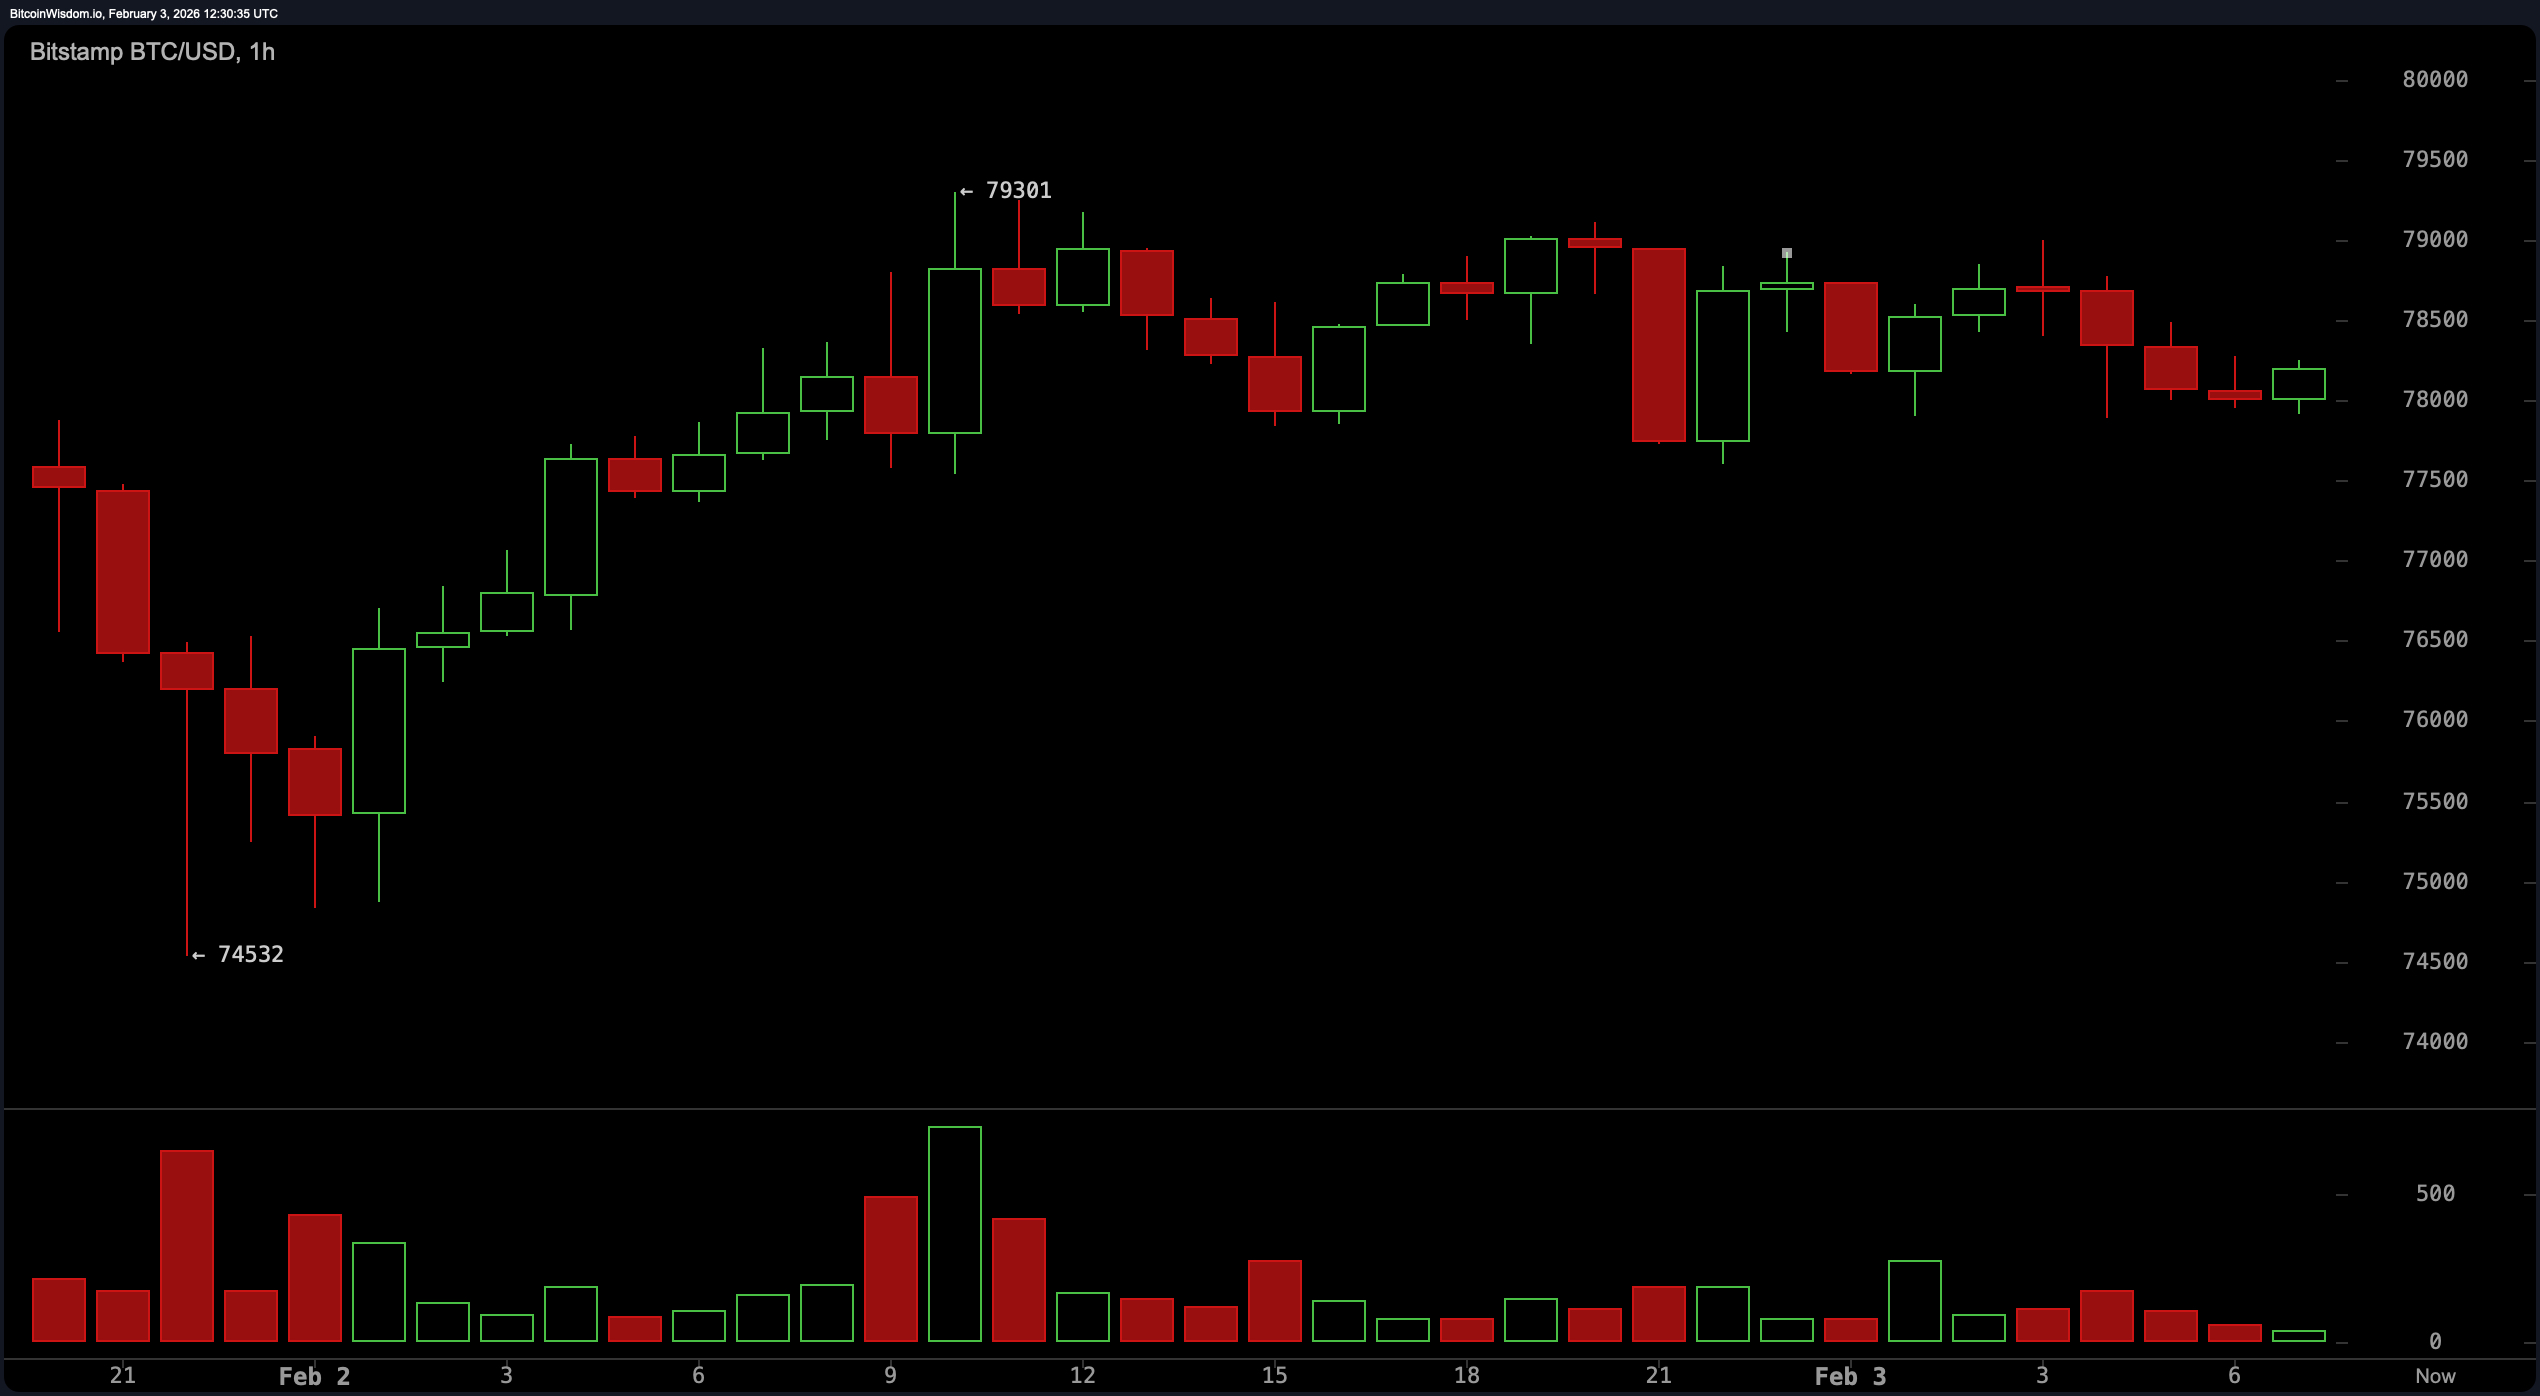
Diving deeper into hourly data uncovers fading momentum after peaking close to $79,301. Lower highs continue forming—a warning sign on short-term charts. Volume has thinned during sideways moves which points toward confusion rather than clear directionality.
This stalling pattern often precedes either sudden upward bursts or disappointing drops, so traders should remain cautious until stronger signals emerge backed by meaningful volume shifts.
Turning attention towards technical indicators—the pulse check for price action—the Relative Strength Index (RSI) hovers at about 29 signaling oversold conditions but without enough force for reliable bullish reversals yet.
The Stochastic Oscillator rests near 17 while Commodity Channel Index (CCI) plunges below −138 both hinting at potential downside exhaustion.
However, momentum readings including MACD remain deeply negative (−10,920 and −3,235 respectively), lacking any signs of bullish strength.
This combination suggests recent rebounds lack vigor or clear trend confirmation.
Looking at moving averages paints Bitcoin as conflicted: The current price sits well below key EMAs such as the 10-period EMA around $82,452 and far beneath longer-term SMAs like the 200-period SMA near $103,541.
This wide gap across multiple timeframes highlights persistent resistance that trend-followers would find discouraging.
Until prices climb back over intermediate averages such as the 50-period EMA,&&án overall technical stance will likely stay defensive.
In summary: Bitcoin isn't out of play but certainly not thriving either. It remains stuck in volatility-driven tug-of-war territory where conviction is scarce while sideways trading dominates.
Only breaking decisively above ~$82,000 or falling under ~$74,500 will clarify future direction — so patience combined with skepticism is advised when analyzing these charts right now.
Bullish Perspective:
If Bitcoin manages a convincing push beyond $󈒜,� accompanied by solid trading volumes — ideally surpassing $&;#x20AC;&;#x20AC;-82k — momentum could swing quickly in favor of buyers.
Such an advance would break current consolidation phases potentially luring trend-followers back into active positions especially given oversold oscillator readings piling up across multiple metrics.
Bearish Outlook:
Unless key moving averages are reclaimed along with clearing overhead resistance around $&;#x20AC;-82k , downward pressure remains dominant .
Current recovery attempts lack structure , strength , plus technicals show lower highs , stiff supply zones overhead , plus weakening momentum .
❓ Frequently Asked Questions
What is bitcoin’s latest market price today?
–>Currently trades close to &dollar ;78, ;162 within last day’s range spanning approximately &dollar ;77, ;642 through &dollar ;79, ;130 .
Is bitcoin trending upwards or downwards recently?
–>Overall bias leans bearish due mainly due high resistance overhead just beyond & d ollar &# x80 ; ;;8000 mark .
Which levels deserve closest attention going forward?
–>Support clusters lie roughly between ~& d ollar &# x74 ; ;;500–& d ollar &# x76 ; ;;000 while significant barriers form nearer ~& d ollar &# x80 ; ;;000–& d ollar #8211;//8230;.
T echnical i ndicators s how b ullish o r b earish t endencies ?
-≫
M ost oscillators alongside m oving average s indicate continued weakness over short term horizon .