
Bitcoin has dipped below the $70,000 mark as selling pressure remains prevalent among cryptocurrency traders. Currently, there is a noticeable lack of robust buying interest that could prevent further declines, and the existing market structure suggests that Bitcoin could potentially fall below $60,000.
Interestingly, an analysis of technical indicators reveals that Bitcoin’s price movements are starting to mirror patterns observed during the bear market of 2022. Historical data indicates that Bitcoin’s bear cycles have gradually become less severe over time.
The Gradual Reduction in Bitcoin’s Bear Market Cycles
A comprehensive examination of Bitcoin’s price history indicates that post-cycle drawdowns have been consistently decreasing with remarkable precision. This trend was highlighted by crypto analyst CrypFlow on social media platform X.
The analyst points out that each significant bear market has resulted in a smaller percentage decline compared to its predecessor. For instance, after reaching its peak in 2011, Bitcoin experienced a staggering 93% drop. The peak in 2013 led to an 87% decline; following the rally in 2017 came an 84% retracement; and finally, after peaking during the bull cycle of 2021, it faced a comparatively modest drop of around 78%.
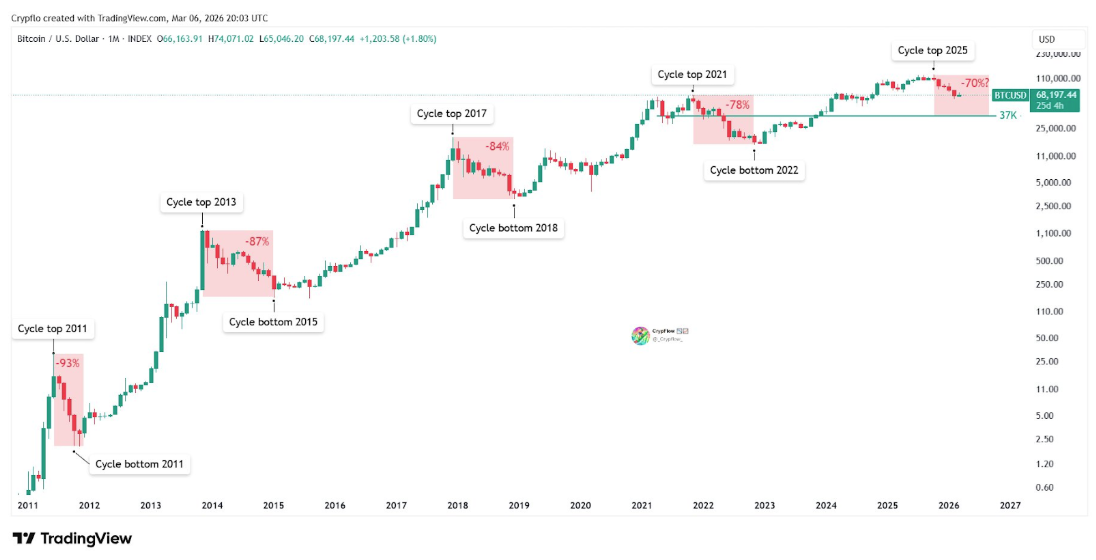
This observation supports the notion that as Bitcoin matures into a more substantial and liquid market environment, its downside volatility has diminished significantly compared to earlier years. In this context, one might anticipate that any future major bear market low would not need to reach levels comparable to previous downturns. Therefore, it seems reasonable to project a worst-case scenario involving a potential drawdown of about 70% from what is expected to be Bitcoin’s peak price in 2025 at $126,080.
If we extend this compression forward into future projections—a hypothetical crash resulting from such conditions would place Bitcoin around $37,000 by then. However,the analyst cautions against interpreting this figure as indicative of an absolute bottom forecasted for prices moving forward. It’s also important to note historically; during past bear markets,Bitcoin has never closed below prior cycle peaks on monthly charts—wherein case for now,the last significant top occurred at approximately $69,000 back in late-2021.
Echoes Of The Familiar Bull Trap From Early-2022 And Potential Decline To $50K
While it’s true that cycles within bitcoin’s bearish trends appear increasingly compressed over time—current pricing dynamics suggest similarities with patterns witnessed throughout early-2022’s downturns according analysis shared by crypto expert Chiefy via X platform.
This setup compares present-day movements alongside those seen back then showing textbook sequences comprising both bull traps following preceding bearish setups respectively within these two distinct periods。.
In September ’22 ,for example ,Bitcoin staged what seemed like recovery bounce near eighteen thousand dollars after experiencing sharp declines ; however ,this culminated instead into classic bull trap formation around twenty-one thousand enticing buyers before ultimately rolling over again creating fresh lows thereafter .
Accordingly according analyses conducted thus far regarding early twenty-sixteen scenarios suggest identical scripts unfolding today : initial downtrend leading towards sixty-thousand dollar range followed subsequently up towards seventy-four-thousand triggering another possible bullish entrapment phase if history repeats itself here . Should these analogies hold true—the next anticipated low point may hover close enough toward fifty thousand dollars per coin based off recent findings presented herein .
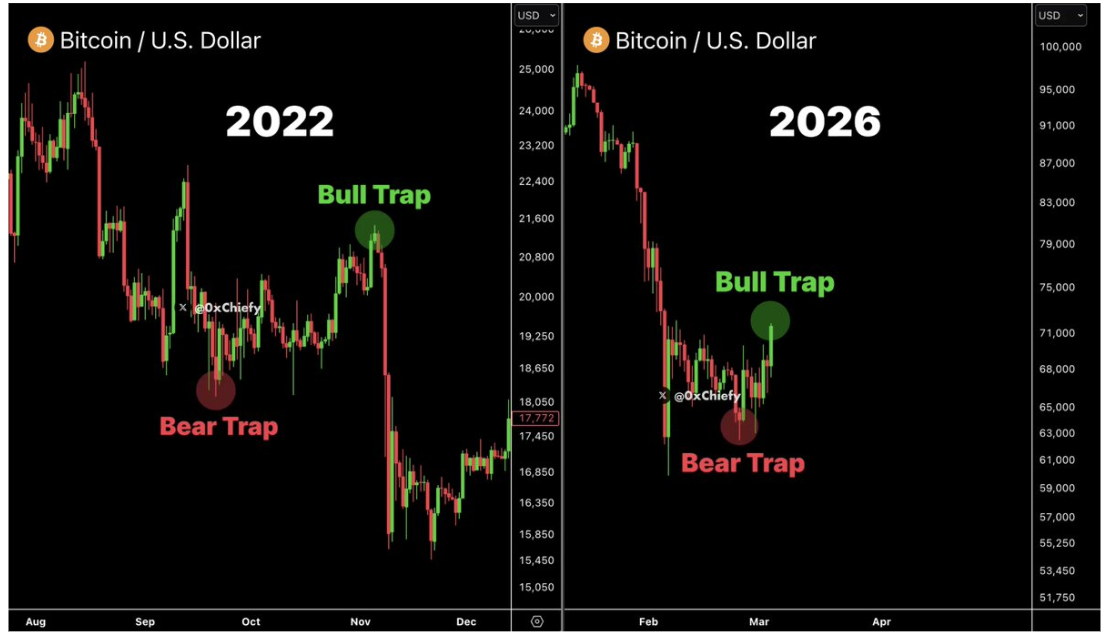
Bitcoin Price Chart Source : @0xChiefy On X
Featured image sourced from Unsplash chart courtesy TradingView