Traders in the Bitcoin market are currently analyzing critical levels as a heatmap indicates a reconstructed liquidity zone at $62,000. Meanwhile, the monthly chart suggests the formation of a potential W pattern within an ascending channel. These indicators illustrate a market caught between short-term downward pressure and a longer-term framework that still allows for another upward movement.
Bitcoin Heatmap Indicates $62,000 Liquidity Zone While BTC Remains Around $66,600
The price of Bitcoin is hovering around $66,600, as traders evaluate changing liquidity conditions noted by market analyst Columbus on X. In his update on Monday, he highlighted new downside liquidity forming near the $62,000 level based on recent MMT heatmap insights. This visualization revealed significant liquidation clusters below the current price point while showing more evenly distributed overhead liquidity in the mid-$70,000 to low-$80,000 range.
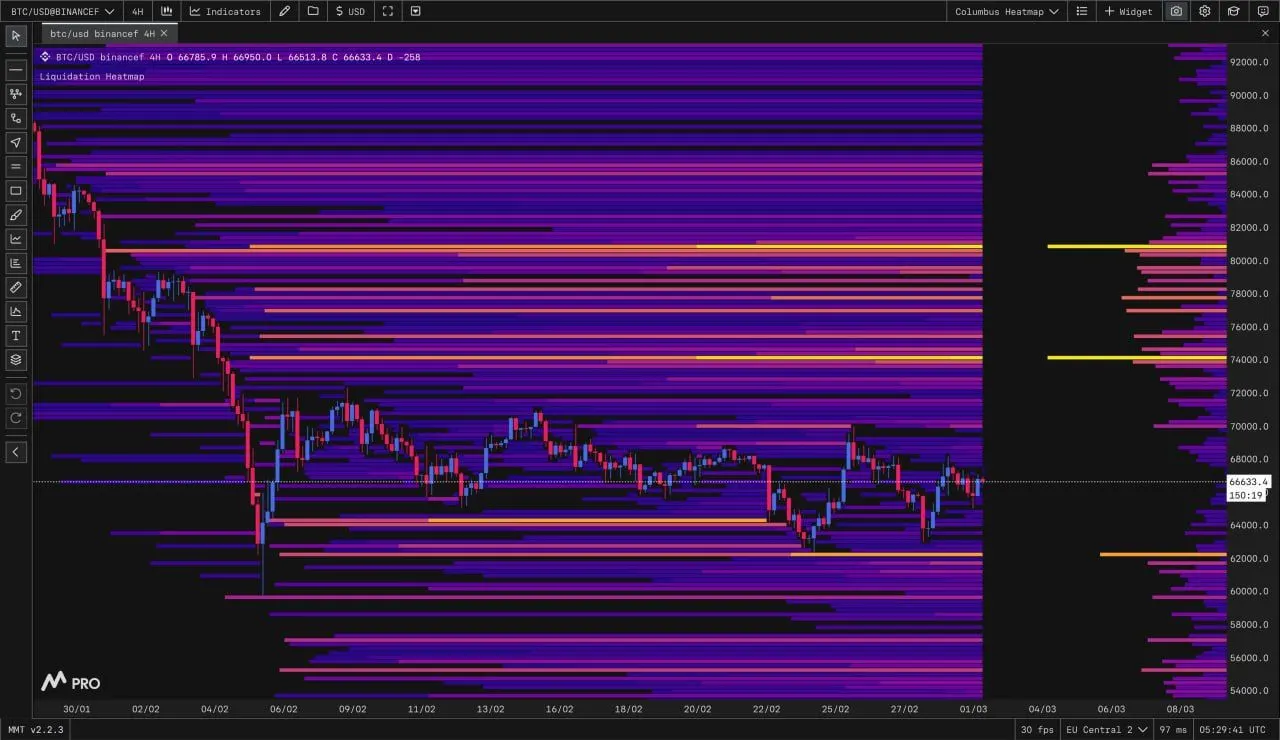
Bitcoin MMT Heatmap 4H Chart Source: Columbus on X
According to Columbus, new pockets of liquidity have emerged across various ranges with particular emphasis just beneath $62,000. He suggested that recent geopolitical developments over the weekend might heighten chances for prices to trend towards this lower boundary early in the week. The heatmap indicated bright horizontal areas below spot prices where leveraged positions could face forced liquidations if tested.
At present, Bitcoin remains within an extended consolidation phase following a sharp decline earlier in February. The chart reveals that prices are compressing between approximately $64,000 and $70,000; however short-lived rallies have failed to lead to sustained upward movements. Columbus remarked that current upward shifts seem more like positioning resets rather than indications of broader expansion phases.
Additonally he pointed out that unless there is a decisive shift in market structure indicating buyers reclaiming higher liquidity zones and invalidating support around $62K , downward pressure remains active . Therefore traders are closely monitoring whether prices will gravitate toward this newly established liquidity area or stabilize above existing support levels in upcoming sessions.
Monthly Chart Reveals Possible W Pattern Within Long-Term Uptrend Channel for Bitcoin
The monthly chart for Bitcoin has garnered attention after analyst Time Freedom ROB identified what appears to be a developing W pattern inside an enduring ascending channel. The TradingView graph illustrates Bitcoin fluctuating between two rising white trendlines which have defined its price action since 2016; previous cycle highs and lows align with repeated tests against both channel support and resistance lines.
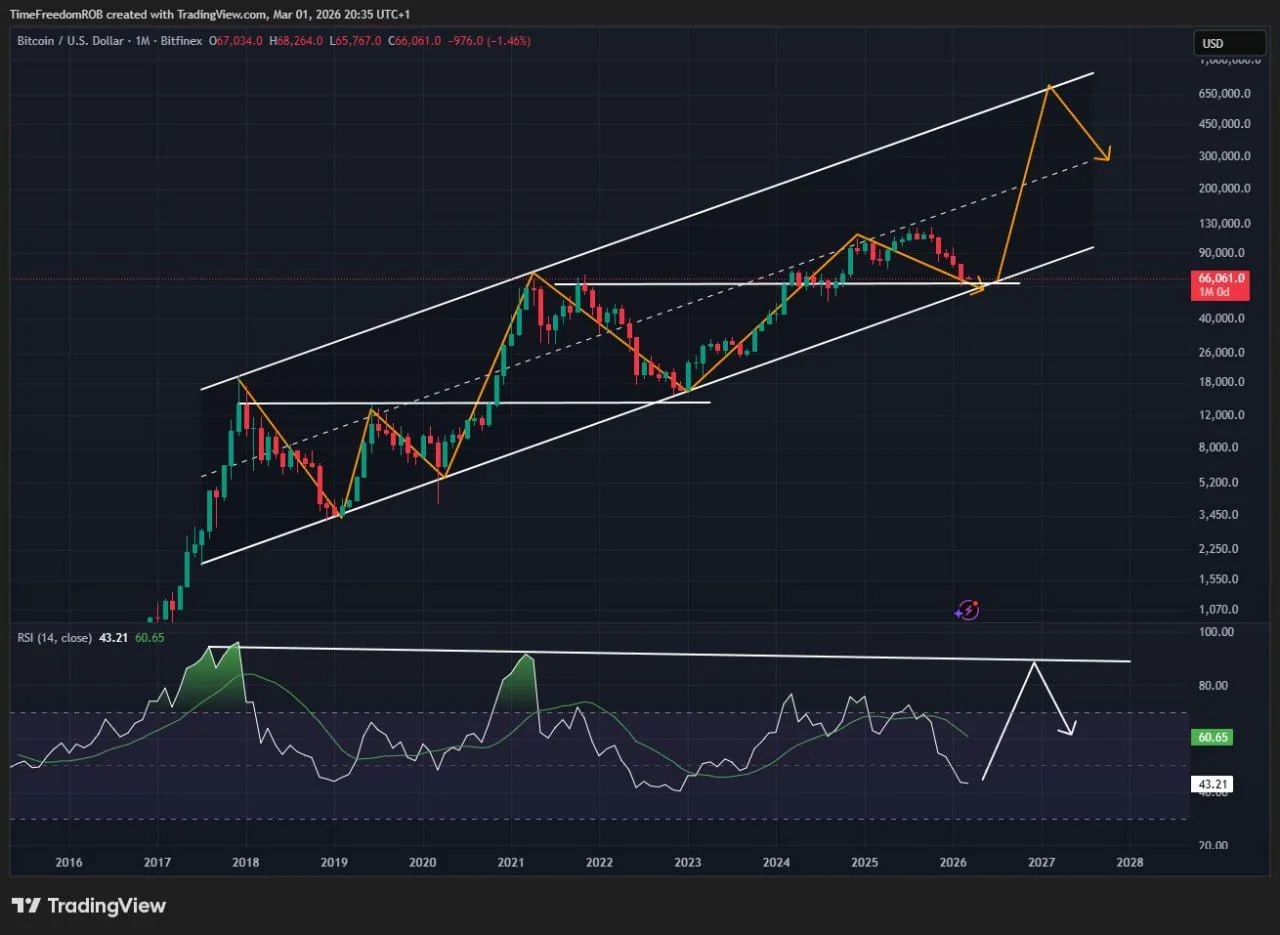
Bitcoin Monthly W Pattern Channel Chart Source: TimeFreedomROB on X
This chart highlights two significant W-shaped formations from prior cycles where each time it formed rounded bottoms close to lower boundaries before surging upwards towards upper trendlines again . Currently observed patterns seem reminiscent , as prices stabilize above candle bodies from previous all-time highs similar setups witnessed post-2018 peak events .
The horizontal levels drawn across former resistance zones now serve as key structural reference points ; historically once these areas were reclaimed during monthly evaluations momentum would typically surge toward upper channel limits . Recent candles indicate consolidation near mid-channel regions while maintaining overall integrity provided pricing stays above rising support lines .
The Relative Strength Index (RSI) analyzed over monthly intervals adds depth into this evaluation process too; past cycle peaks aligned closely with RSI readings nearing overbought territory followed by rapid corrections thereafter! Presently though current RSI stands firmly positioned within mid-range territory having cooled off from earlier high marks indicating possible further ascension ahead before another potential rollover occurs later down road!
“Time Freedom ROB also emphasized how important it is observe if channels continue guiding our actions going forward because historical trends suggest expansions usually follow prolonged consolidations situated nearby supportive structures! However confirmation hinges upon consistent strength maintained throughout rising channels alongside breaks pushing us closer towards those upper boundaries!”