The on-chain metrics within the Bitcoin ecosystem continue to shed light on investor attitudes and the overall market dynamics.
Recent findings indicate a prevailing sense of caution among market participants, yet some indicators suggest that many investors are still enjoying profits.
The Fear and Greed Index indicates that Bitcoin holders are currently experiencing significant anxiety. The index shows a score of just 15 points, placing the market firmly in the “Extreme Fear” category.
Currently, Bitcoin is trading at around $71,400. The Realized Price—a crucial benchmark derived from on-chain data—sits near $54,400. This positioning above the Realized Price suggests that most investors have acquisition costs exceeding current market prices, indicating ongoing profitability across the broader landscape.
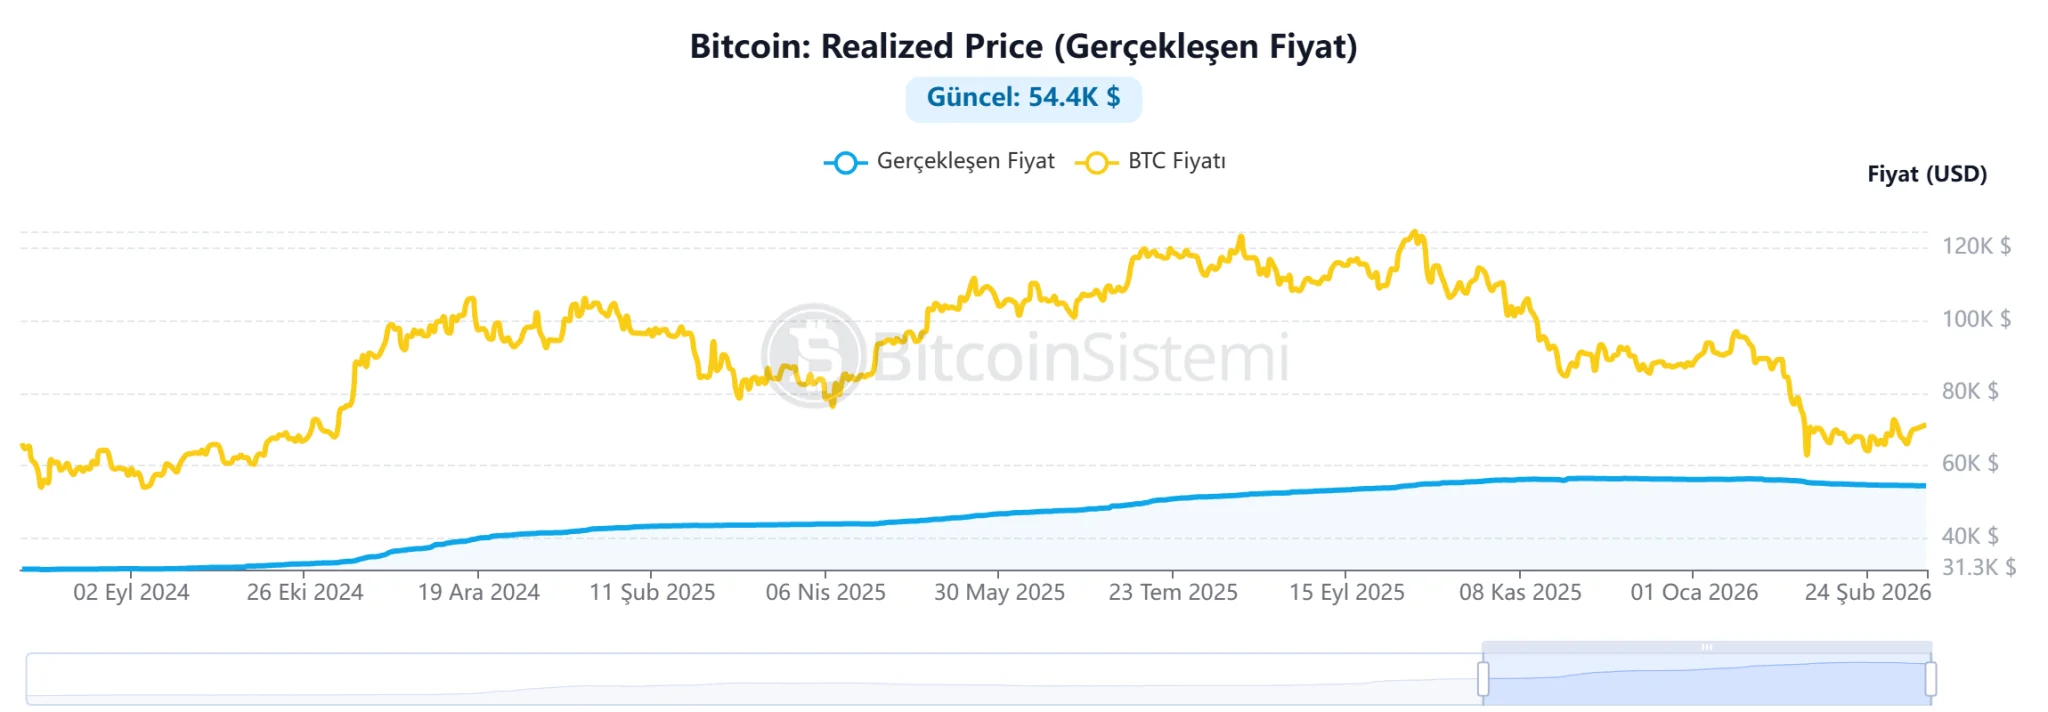 Actual price information for Bitcoin.
Over the past day, short positions dominated liquidation events. Approximately $53 million worth of shorts were liquidated compared to about $11 million in long positions being closed out.
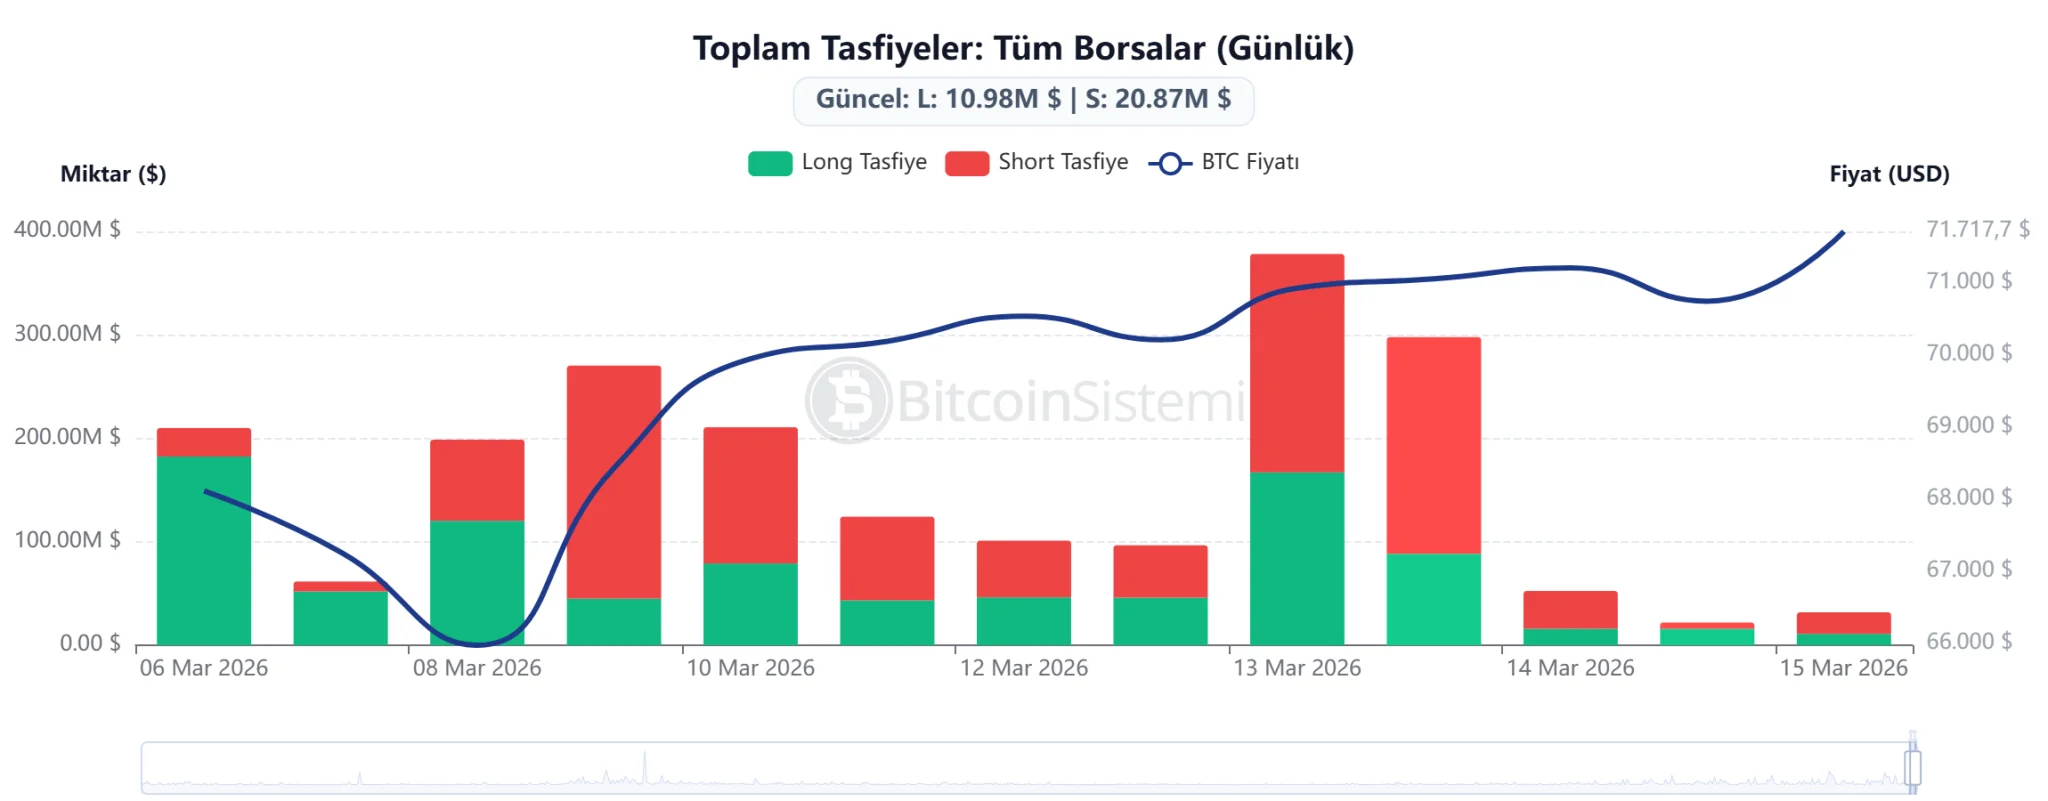 A chart illustrating liquidation statistics across the cryptocurrency sector over recent days.
An additional key metric—the MVRV (Market Value to Realized Value) ratio—is currently recorded at 1.31. This ratio assesses how much higher Bitcoin’s total market capitalization is relative to what investors have paid on average. Historically speaking, an MVRV exceeding 3.7 signals potential overvaluation and possible macroeconomic peaks ahead; conversely, values dipping below 1 typically correlate with significant downturns in price.
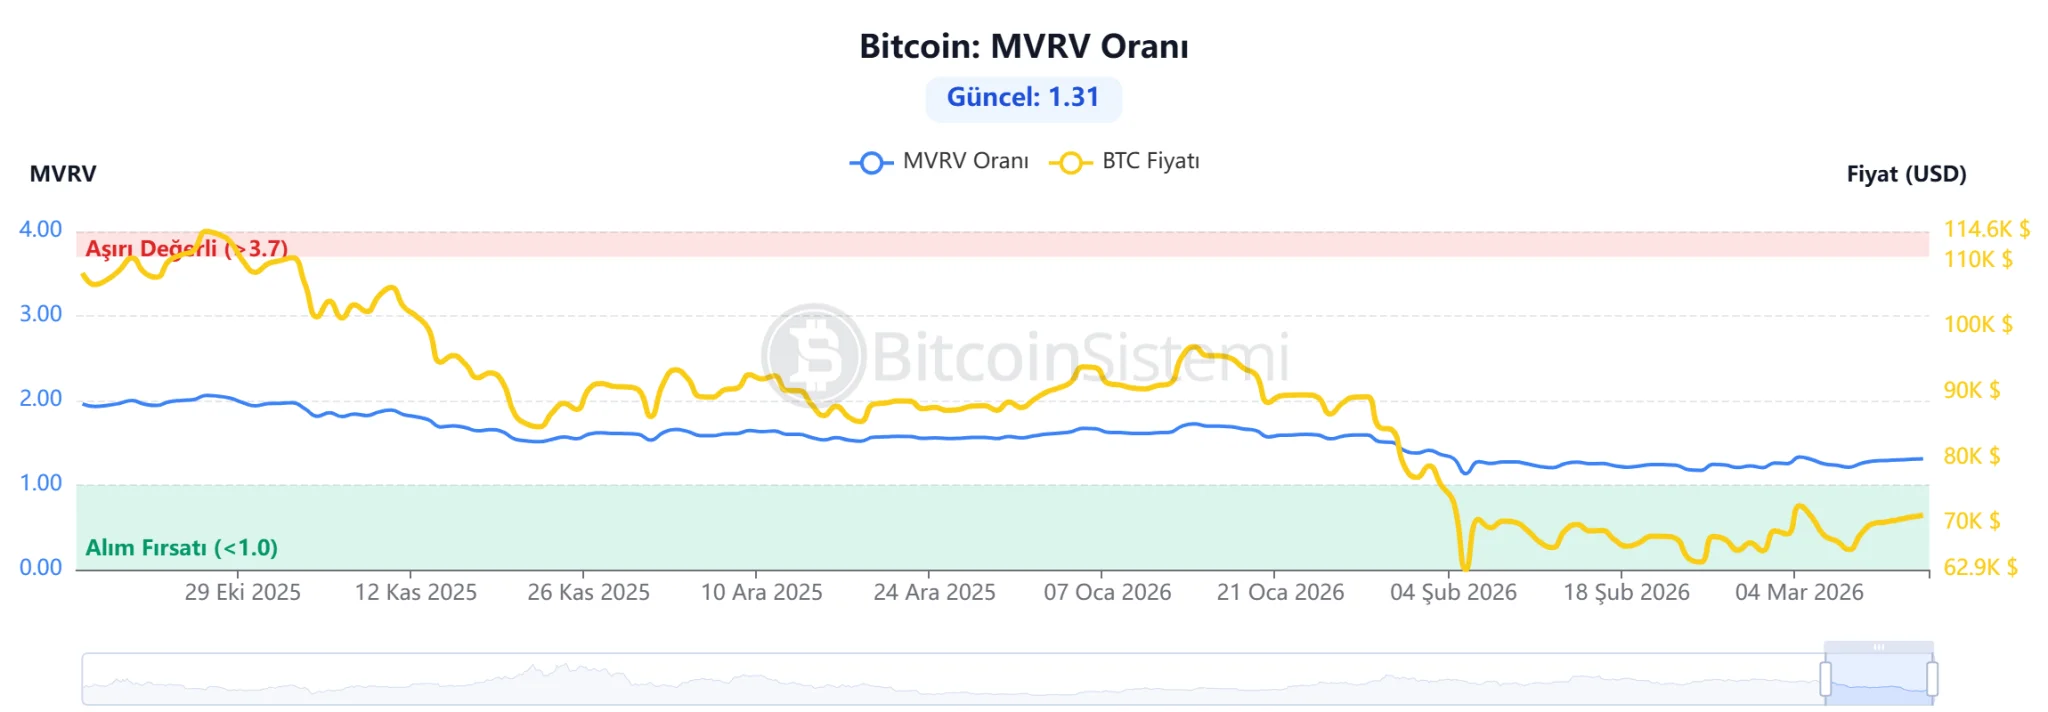 A graph displaying MVRV data for Bitcoin.
The Net Unrealized Profit/Loss (NUPL) ratio stands at 0.24 right now—this metric evaluates whether investors are generally profiting or losing money within this context. A reading of this nature implies that while many participants remain profitable overall, we haven’t yet reached a state of rampant enthusiasm in trading behavior; historically speaking, NUPL readings above 0.7 often coincide with markets nearing their peak performance levels while those below zero can indicate capitulation phases or bottoming out scenarios.
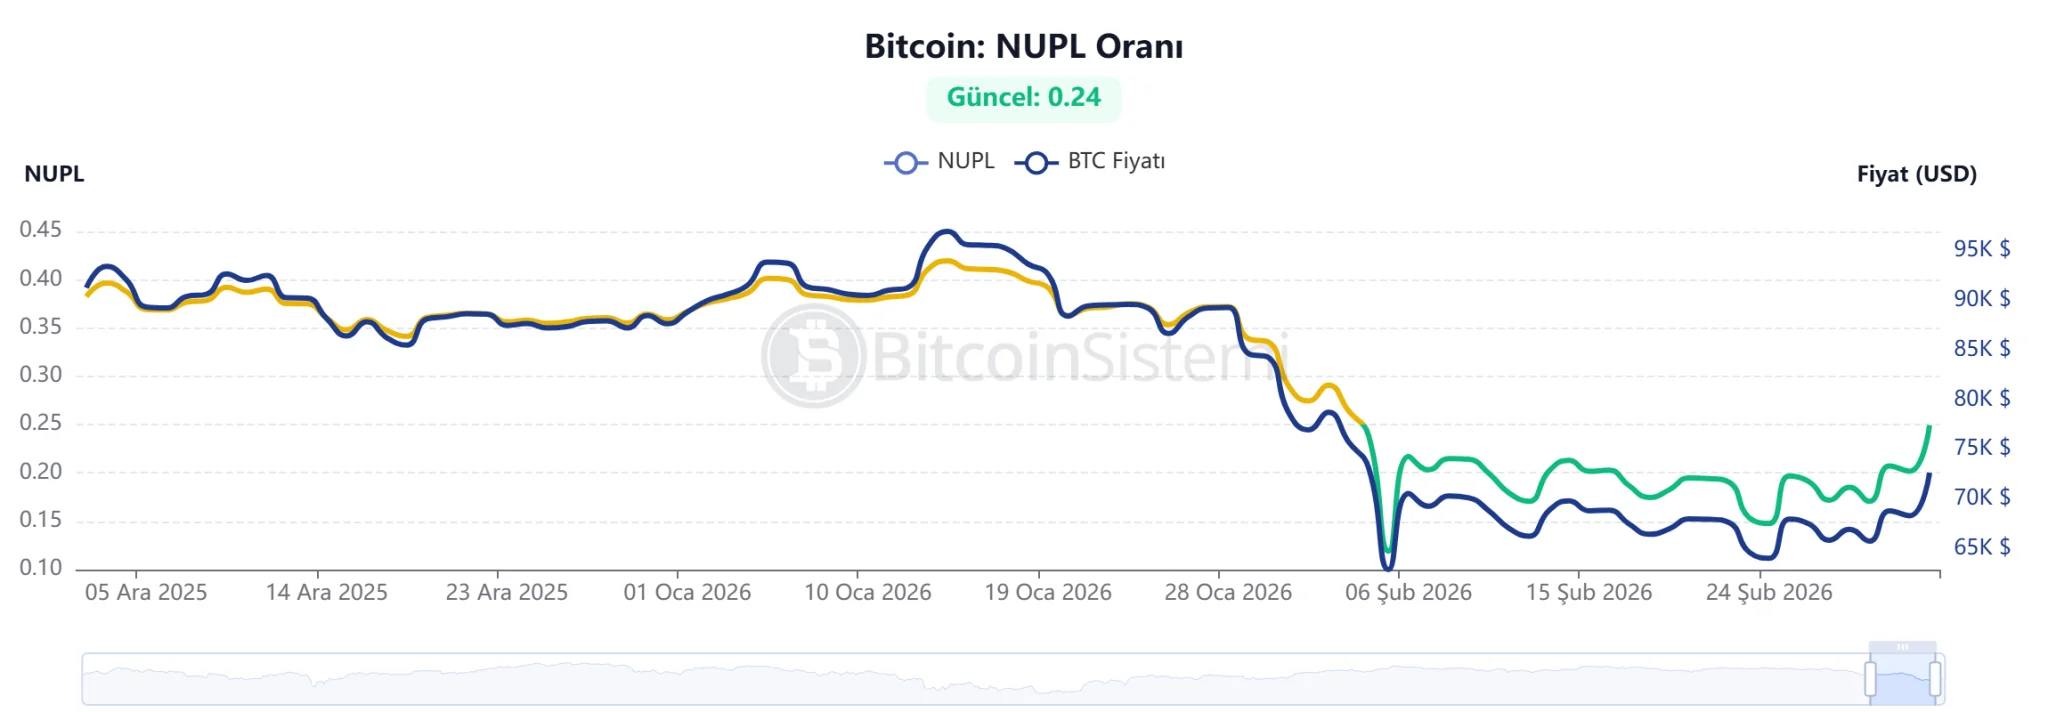 A graph showcasing NUPL data for Bitcoin.
*This content does not constitute financial advice.