The dynamics of Bitcoin have become more robust as the selling pressure has diminished and institutional interest has intensified.
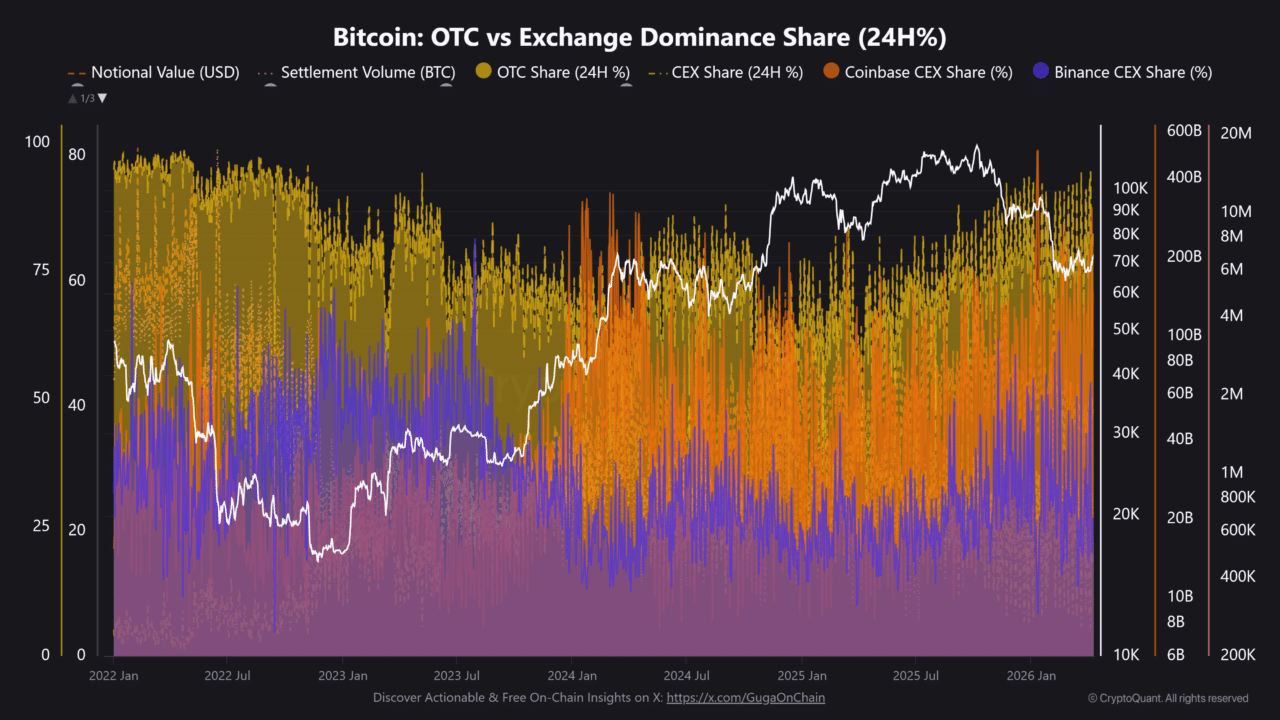
Over-the-Counter (OTC) trading surged to 82.26%, signifying a significant shift of activity away from traditional exchanges. Major investors seem to be absorbing the available supply with little price impact, while only 17.14% of transactions remained on exchanges, with Coinbase accounting for 58.21% of that volume.
Simultaneously, Long-Term Holders (LTHs) have largely remained inactive in the market. A mere 94.68 $BTC worth of older coins transitioned to exchanges, despite an impressive settlement volume reaching 706,000 $BTC.
This situation creates a notable imbalance in the market; with supply being locked up and demand becoming concentrated, Bitcoin [$BTC] is nearing $72,000 under these tightening conditions.
If this demand remains steady, we could see rapid price adjustments; however, weak inflows might hinder momentum around resistance levels.
What’s Causing the Decline in Selling Pressure?
The tightening institutional flows have led to a decrease in selling momentum within the market.
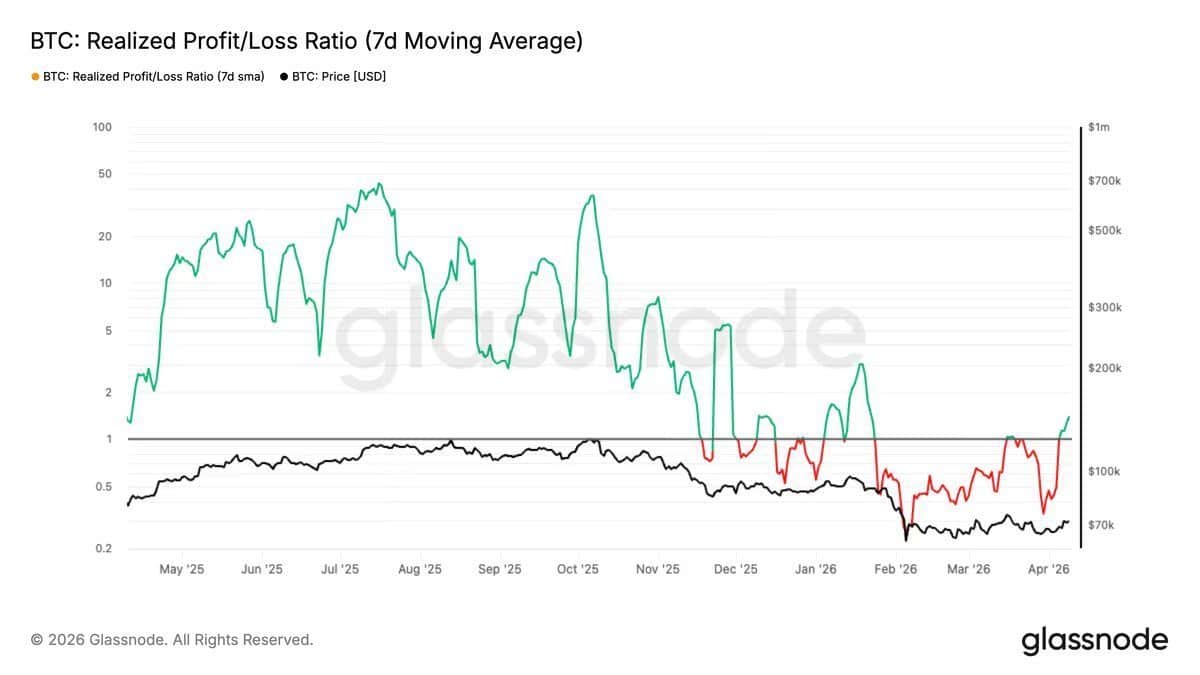
Previously recorded Realized Losses were soaring towards $400 million daily due to forced sell-offs; however, this trend appears to be subsiding as most weaker participants seem to have exited already.

This change has altered market behavior significantly; as losses decreased, the Realized Profit/Loss Ratio approached parity at around 1—indicating more balanced positions among traders.
A reduced number of traders are feeling compelled to sell their holdings now which alleviates some downward pressure on prices. Nevertheless, consistent demand is essential for any upward movement in prices going forward.
Where Might $BTC Encounter Resistance?
The tightening supply means that prices are approaching between $73,000 and $74,000 zones.
The Liquidation Heatmap indicates substantial liquidity clusters above this range—these areas often serve as targets since liquidation zones can attract volatility spikes during trading sessions.
An earlier rejection at $71K showcased weak follow-through after tapping into nearby liquidity which triggered liquidations but reversed quickly due to limited spot demand from buyers.

Source : CoinGlass
This scenario sets up a clear trigger point ; if there’s sustained movement beyond $73K , it could propel prices into thinner liquidity ranges . Conversely , failure at higher levels may confine $ BTC within its current range .
The contraction of Bitcoin’s losses alongside increased OTC activity has tightened overall supply conditions ; nevertheless , maintaining focus on that pivotal level around $73K will be crucial for any directional shifts moving forward .
A Brief Conclusion:
The availability of Bitcoin is decreasing as OTC dominance surpasses 82%, while diminishing Realized Losses render pricing sensitive even amidst slight changes in demand dynamics.
An important threshold lies near $73K where ongoing spot interest may catalyze breakout opportunities while insufficient follow-through keeps values constrained within established ranges.