
Although Bitcoin has seen a notable decline from its all-time highs earlier last month, it continues to test essential levels that may influence its future movements. Recent insights from crypto analyst Casitrades indicate that the upcoming days could determine whether the market will undergo a macro correction or continue its bullish trend. Currently, Fibonacci retracement levels, Elliott Wave patterns, and Relative Strength Index (RSI) trends converge to create a significant narrative regarding BTC’s price direction.
Potential Outcomes for Bitcoin Price Macro Correction
On Friday, Casitrades shared in an X social media update that Bitcoin’s recent price increase has approached the 0.5 Fibonacci retracement level near $116,000—an important benchmark during this recovery phase. Notably, despite this sudden upward movement, the RSI displayed on the chart has yet to indicate typical exhaustion associated with major peaks. This implies that buyers might still have capacity to push prices higher before encountering resistance.
The analyst emphasized $118,000 as another critical level to monitor since it aligns with both the 0.618 Fibonacci retracement and the 1.236 C-wave target within an evolving Wave 2 structure. Casitrades referred to this area as a pivotal confluence point; if there is a sharp rejection at this level, it could confirm that Bitcoin’s bullish momentum has come to an end and support theories suggesting it remains in a Wave 2 macro correction phase.
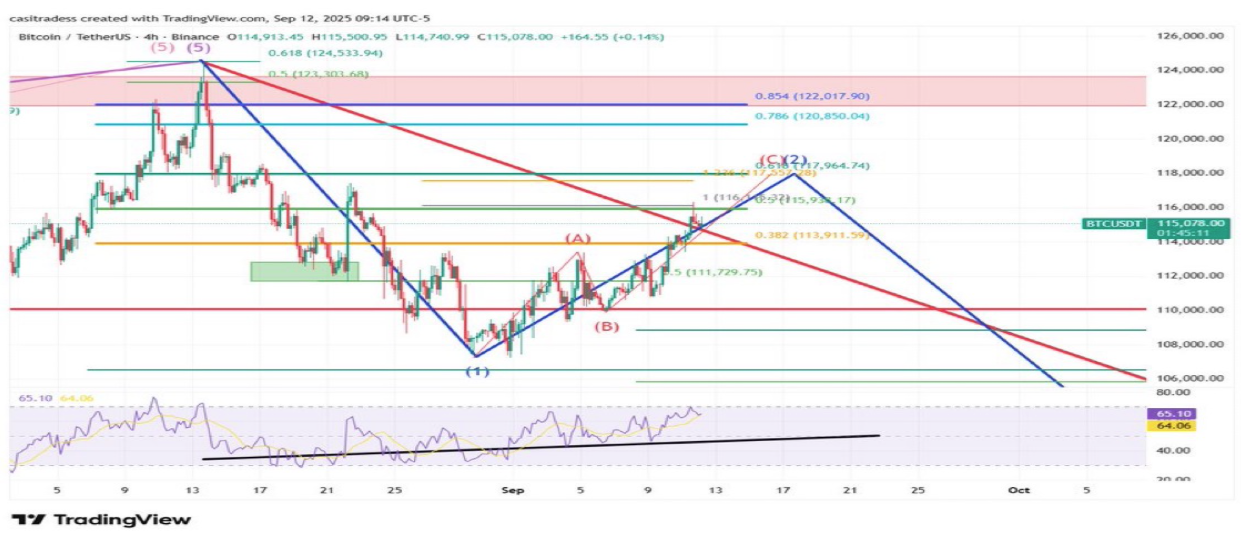
Conversely, if BTC forms a peak around this crucial confluence point without breaking through new all-time highs and instead experiences deeper retracements; potential downside targets are significantly lower than current price levels above $115,800. A failure at $118,000 could trigger sharper corrections dragging cryptocurrency back into the range of $110,000 – $106,000 shortly.
$122K Represents Final Challenge for Macro Correction
While $118K serves as initial resistance for Bitcoin’s trajectory upwards; Casitrades noted that if momentum remains strong enough—Bitcoin might rally further into the zone of $120K – $122K which represents crucial testing ground determining whether macro correction persists or fails altogether due aligning with key Fibonacci levels such as 0.786.
The expectation is clear: should Bitcoin’s RSI exhibit signs of fatigue while facing robust rejection within these boundaries—the resulting correction could be rapid and substantial indicating setup towards broader downturns confirming assumptions about recent rallies being corrective rather than sustained growth phases.
This anticipated correction may reset overall market structures allowing healthier long-term pricing actions moving forward; however should BTC convincingly surpass through thresholds above$122k—it would invalidate prevailing narratives surrounding macro corrections potentially pushing prices toward ranges between$122k-$124k according To casitrade observations!
Featured image from Unsplash; chart sourced from TradingView