Bitcoin has regained the $71,000 threshold following a tumultuous weekend, as traders returned to riskier assets after a surprising easing of geopolitical tensions. Reports indicate that President Donald Trump announced a five-day delay on U.S. strikes against Iranian energy facilities, which catalyzed a relief rally across both stock and cryptocurrency markets. However, this rebound only partially recovers the losses incurred recently.
According to CoinMarketCap data, Bitcoin is still down 1.08% for the week but was trading around $71,372 with an increase of 1.83% in daily performance. Additionally, its trading volume surged by 10%, reaching $40.75 billion within 24 hours. This raises an important question: does this bounce signify genuine demand or is it merely a quick reset following significant sell-offs?
The market has shown signs of recovery from stress but has yet to reclaim previously breached levels. This situation leaves investors caught between improving momentum and unresolved damage—a scenario that often leads to sharp fluctuations in both directions before any trend confirmation occurs.
What Factors Are Propelling Bitcoin Upward Today?
The primary catalyst for today’s rise appears to be macroeconomic relief rather than any specific developments within the cryptocurrency sector itself. Reports suggest that global stock markets have rebounded while oil prices have dropped following Trump’s remarks; meanwhile, Iranian media refuted claims of ongoing negotiations—an essential shift since Bitcoin tends to behave like a high-beta asset during times of conflict and uncertainty.
This upward movement also extended throughout the broader digital asset landscape; total cryptocurrency market capitalization increased by 1.61%, indicating that this surge wasn’t limited solely to Bitcoin but reflected overall market sentiment and positioning instead.
Furthermore, leverage played a role in amplifying these movements—CoinGlass data reveals that short liquidations for $BTC reached approximately $158 million over the past day alone, highlighting how quickly this rebound occurred—a critical distinction as relief rallies can often gain momentum without lasting impact.
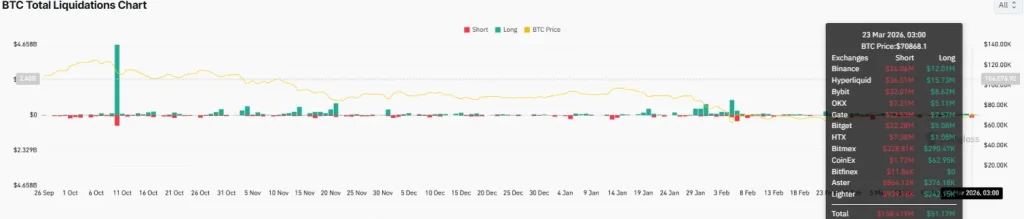
Source: CoinGlass
As headlines become less alarming, those holding short positions tend to exit first while long-term investors typically join later with more caution regarding their entries into trades—the next test will simply be whether actual demand follows after initial forced buying subsides.
An Analysis of Bitcoin’s Technical Landscape
The most crucial support level currently lies between $62,525 and $59,930—this range has held firm despite experiencing declines up to 38% from mid-January highs and closely aligns with the 200-week moving average at around $59,274 making it vital on technical charts.
A retest at these levels could determine if broader market conditions are stabilizing or deteriorating further; conversely above lies initial resistance ranging from approximately $74K-$78K—with notable Fibonacci retracement at about $75K within this zone—which rejected last week’s recovery attempt followed by an approximate pullback toward values near $67K.
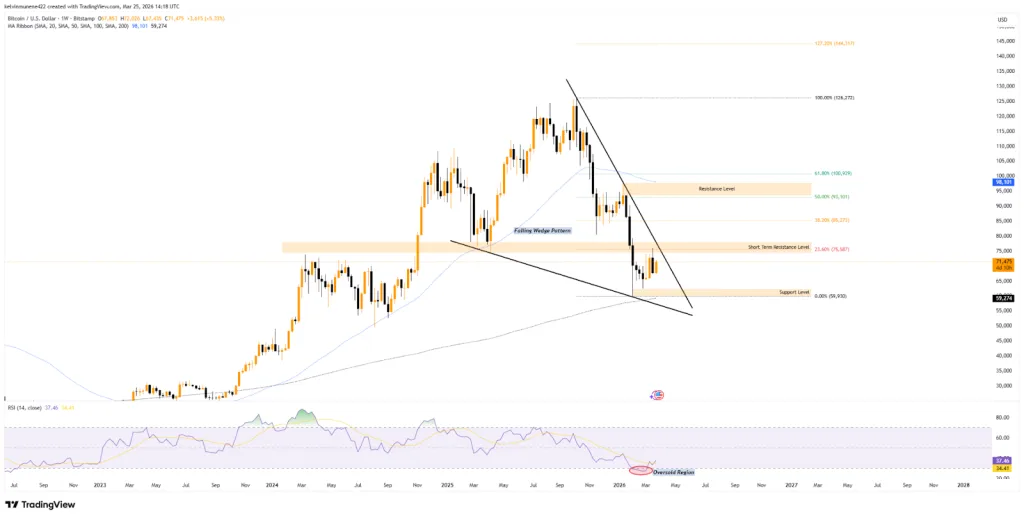
Source: TradingView
A higher resistance area exists between roughly$93K-$97K close enough where we see significant retracement alongside key averages suggesting major obstacles unless there’s substantial momentum improvement observed soon enough—the price remains confined amid solidified support below coupled with overhead supply constraints above it all!
This current environment emphasizes importance beyond mere daily gains because rallies frequently stall when buyers encounter clustered resistances! As long as prices remain ensnared inside defined ranges then opportunities exist—but structural clarity hasn’t been achieved yet!
Diving Into The Longevity Of The Rally
Currently available momentum indicators reflect attempts towards recovery rather than signaling confirmed trend reversals just yet! Daily RSI climbed back up nearing value points around thirty-seven having moved upwards post hitting lows below thirty indicating renewed buying pressure returning however remains under fifty thus keeping general sentiment leaning bearish still overall !
This blend presents cautious outlooks ahead where conditions appear bettering albeit control hasn’t fully shifted quite so far either way! On another note though falling wedge patterns add bullish elements technically speaking since they usually mark exhaustion phases during downward trends – nevertheless confirmations hold greater weight compared against mere pattern recognition alone here too !
A closing price exceeding seventy-two thousand dollars or breaking through upper band limits established via wedge formations would bolster arguments favoring runs into resistant territories whereas failures could lead back down toward sixty-seven thousand four hundred thirty-five followed potentially deeper supports thereafter . Sustained pushes breaching prior boundaries stand as stronger evidence confirming bounces evolving into larger recoveries eventually !
Thus present recoveries may be deemed “constructive” yet “conditional.” Improvements show chart enhancements made ,but they haven’t negated overarching bearish frameworks completely just yet either ; until such time occurs ,rallies remain interpreted more along lines indicative relief moves showcasing improving internals without achieving full resets whatsoever thus far .
Disclaimer : Information provided herein serves educational purposes only & should not constitute financial advice – always perform due diligence independently & consult professionals prior engaging investments accordingly ; CryptoTale bears no liability stemming losses arising usage content herein presented .