Following a significant downturn in November of last year, Bitcoin has entered a phase of price stabilization. Although the overall market trend remains under pressure, recent price movements are narrowing within a tightening range. Indicators suggest that demand from U.S. spot buyers is weakening, and with prices lingering below key moving averages, traders should closely monitor support zones and assess whether buying momentum can be restored.
Bitcoin Price Overview: Daily Perspective
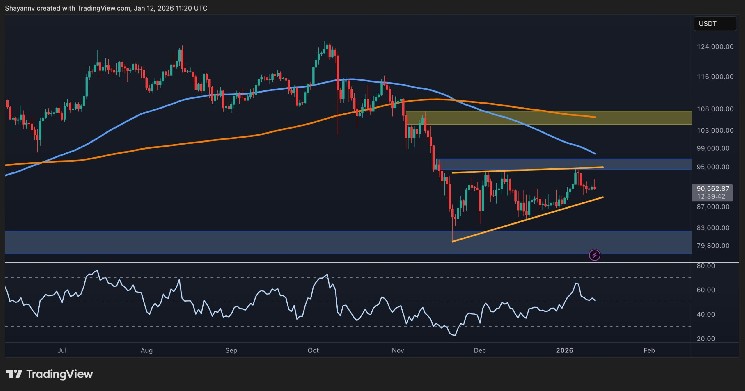
Examining the daily chart reveals that Bitcoin is currently forming a distinct rising wedge pattern after its rebound stalled just shy of the $95,000 resistance level. This wedge is becoming increasingly compressed as both its upper and lower boundaries have been tested multiple times, signaling an imminent breakout. The 100-day and 200-day moving averages remain above current prices, serving as dynamic resistance near $98,000 and $105,000 respectively.
The recent rejection at the $95K supply zone aligns with the upper boundary of this wedge formation. Meanwhile, the Relative Strength Index (RSI) has cooled down from overbought conditions to hover around 50—indicating neither strong bullish nor bearish momentum but leaving room for potential upward movement if buyers re-enter aggressively.
If this wedge breaks downward, key support can be expected near $80K. Conversely, for any meaningful rally to develop on the upside, Bitcoin must reclaim levels above $95K and surpass these critical moving averages before confirming renewed bullish strength.
BTC/USDT Short-Term Analysis: 4-Hour Chart
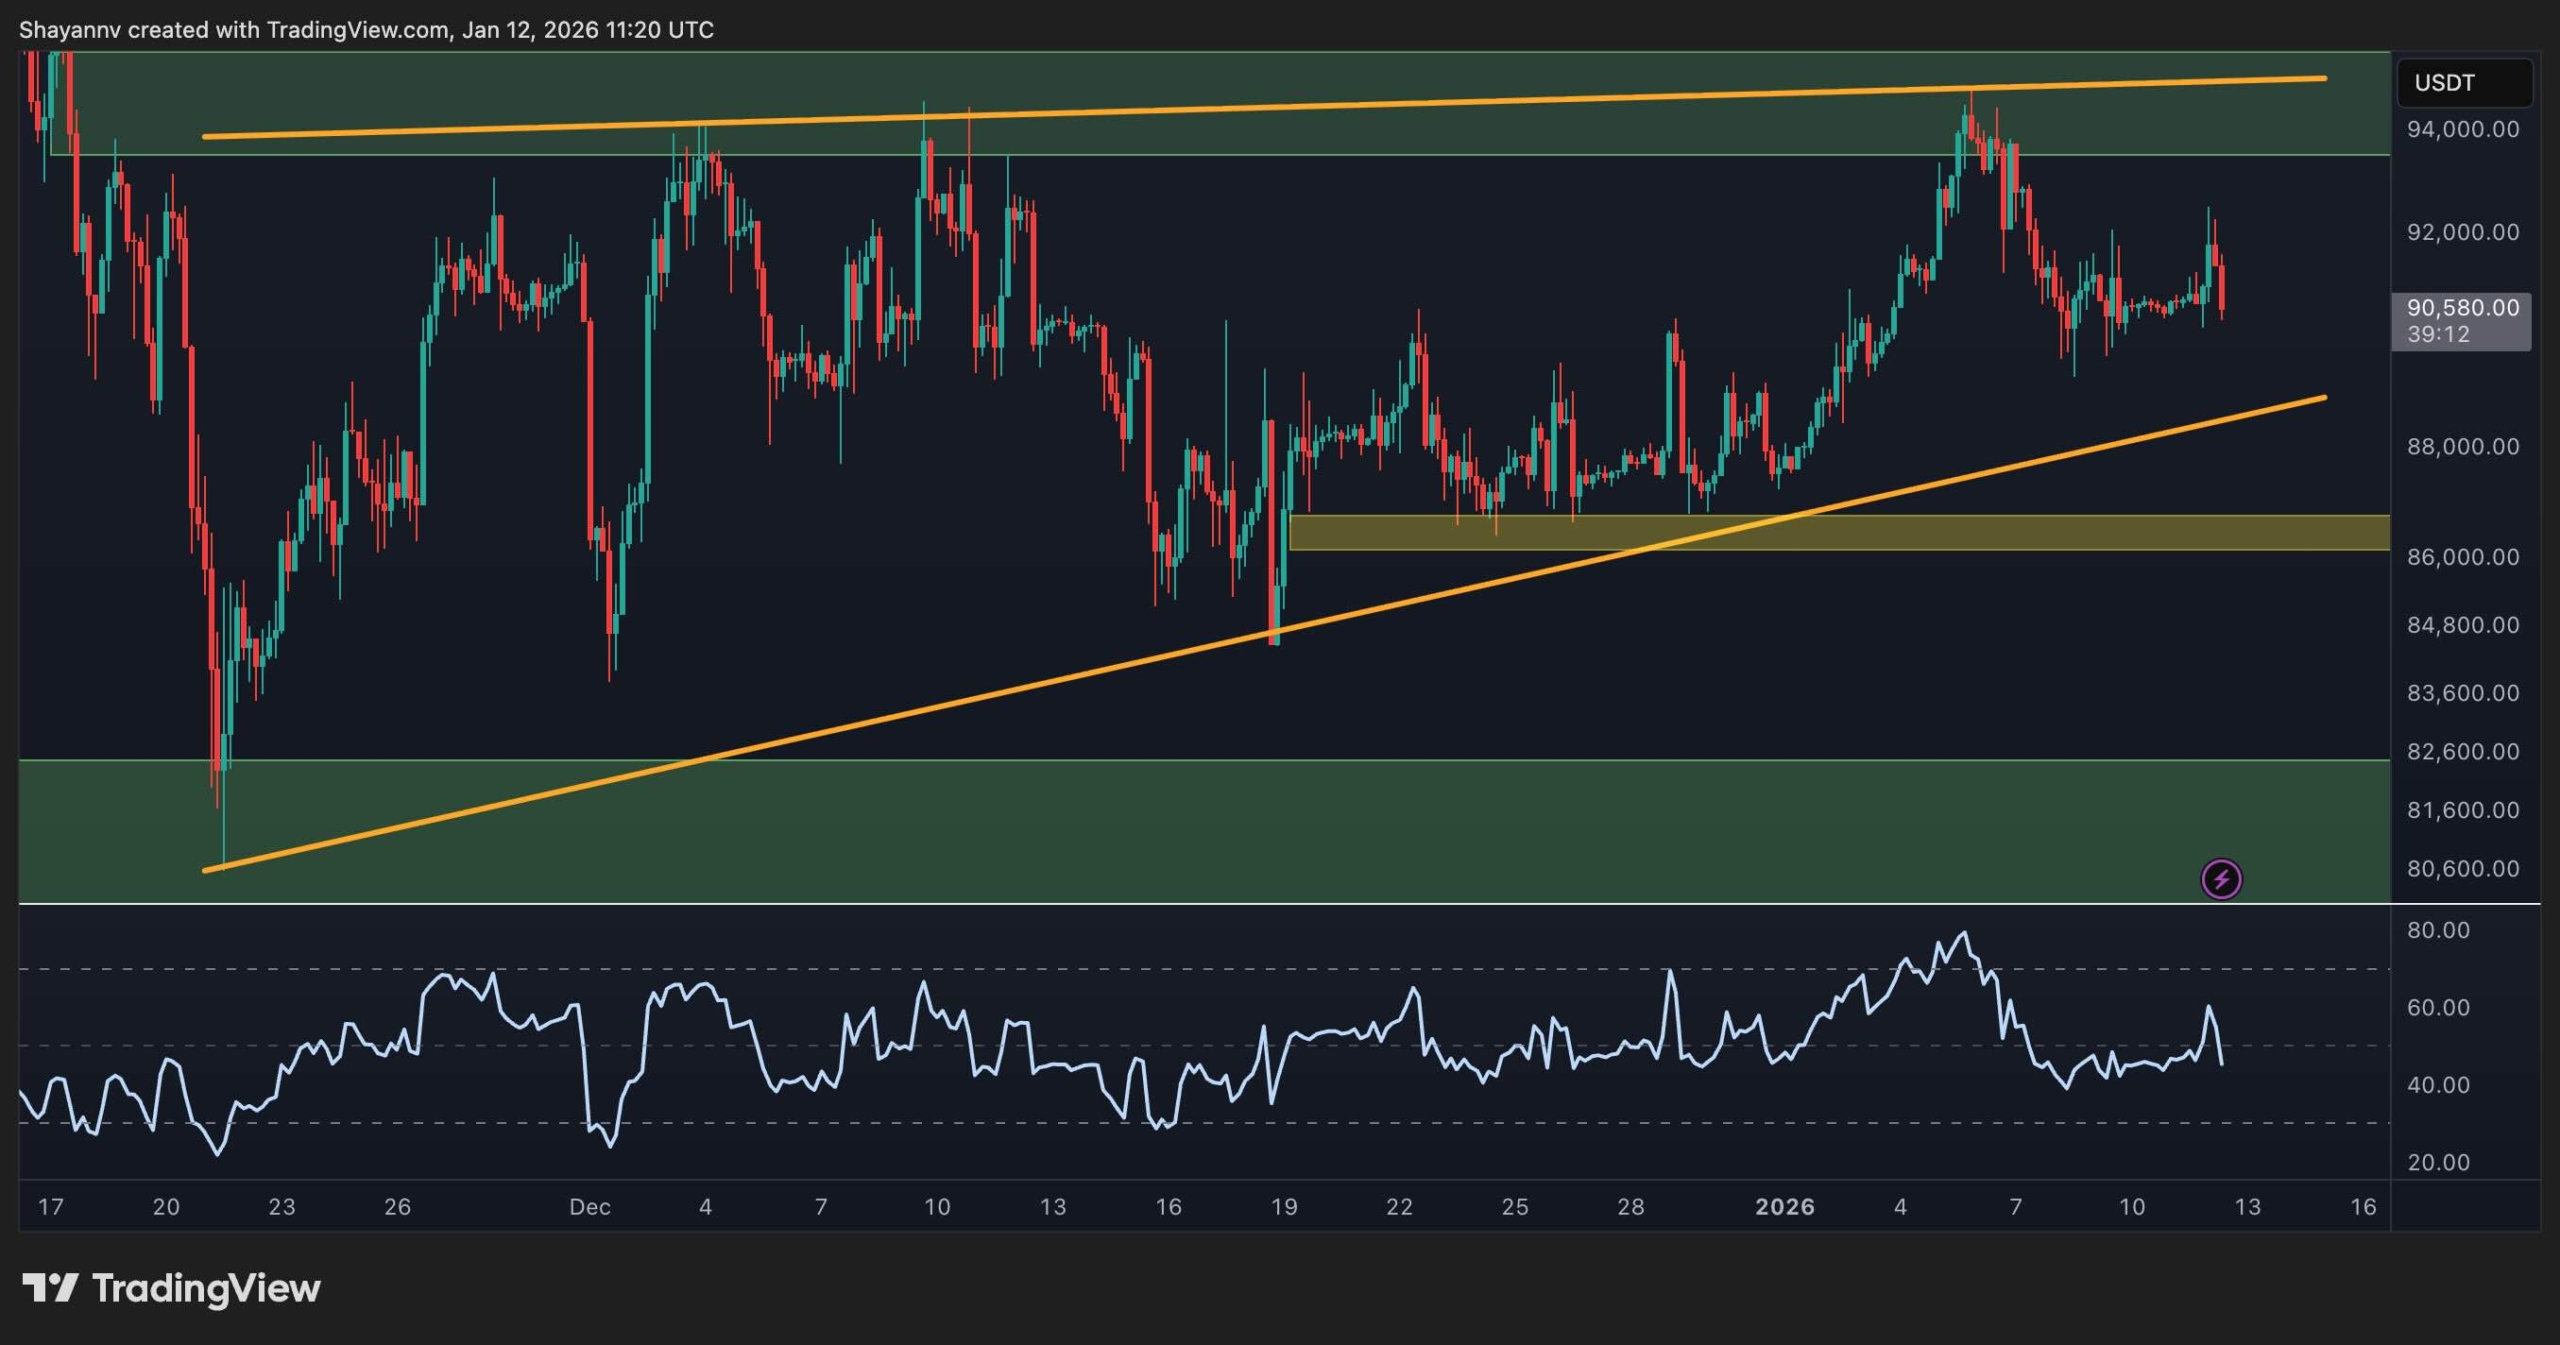
A closer look at the four-hour timeframe highlights this same rising wedge pattern more clearly. Price action continues to respect an ascending trendline originating from November’s lows but struggles repeatedly to break through resistance around $95K.
The momentum on shorter timeframes appears erratic without decisive moves by either bulls or bears. Buyers have defended mid-range levels along with this trendline multiple times; however,the lack of strength near major resistance points raises concerns about sustained upward progress.
A breakdown beneath approximately $88K could prompt retesting high-volume areas close to $86K—and potentially push BTC toward stronger demand zones near $80K. On the other hand ,if buyers manage to surpass previous highs around$92kand clearthe crucial$95kresistancelevel ,an aggressive advance towardthe psychologically important$100kmarkcouldensue .
Market Sentiment Insights
The Coinbase Premium Index—which measures price differences between Coinbase exchange rates versus global platforms—has recently shown notable negative values remaining firmly in negative territory.
This index historically spikes positively during major uptrends fueled by U.S.-based spot investors.
The ongoing negative premium suggests diminished interest among U.S institutional & amp retail participants—a warning sign that recent gains may lack sustainability.
This metric often precedes deeper corrections during pullback phases so until it returns positive ,bullish signals should be approached cautiously .