Bitcoin Price Falls Below $111,000
The value of Bitcoin ($BTC) has dipped beneath the $111,000 threshold, raising fresh concerns within the cryptocurrency community. This recent decline serves as a significant test of Bitcoin’s durability as investors closely monitor essential support levels for hints on future movements. Currently priced at $110,983, BTC has slipped below its short-term moving averages with the 50-day SMA ($114,262) now serving as a barrier.
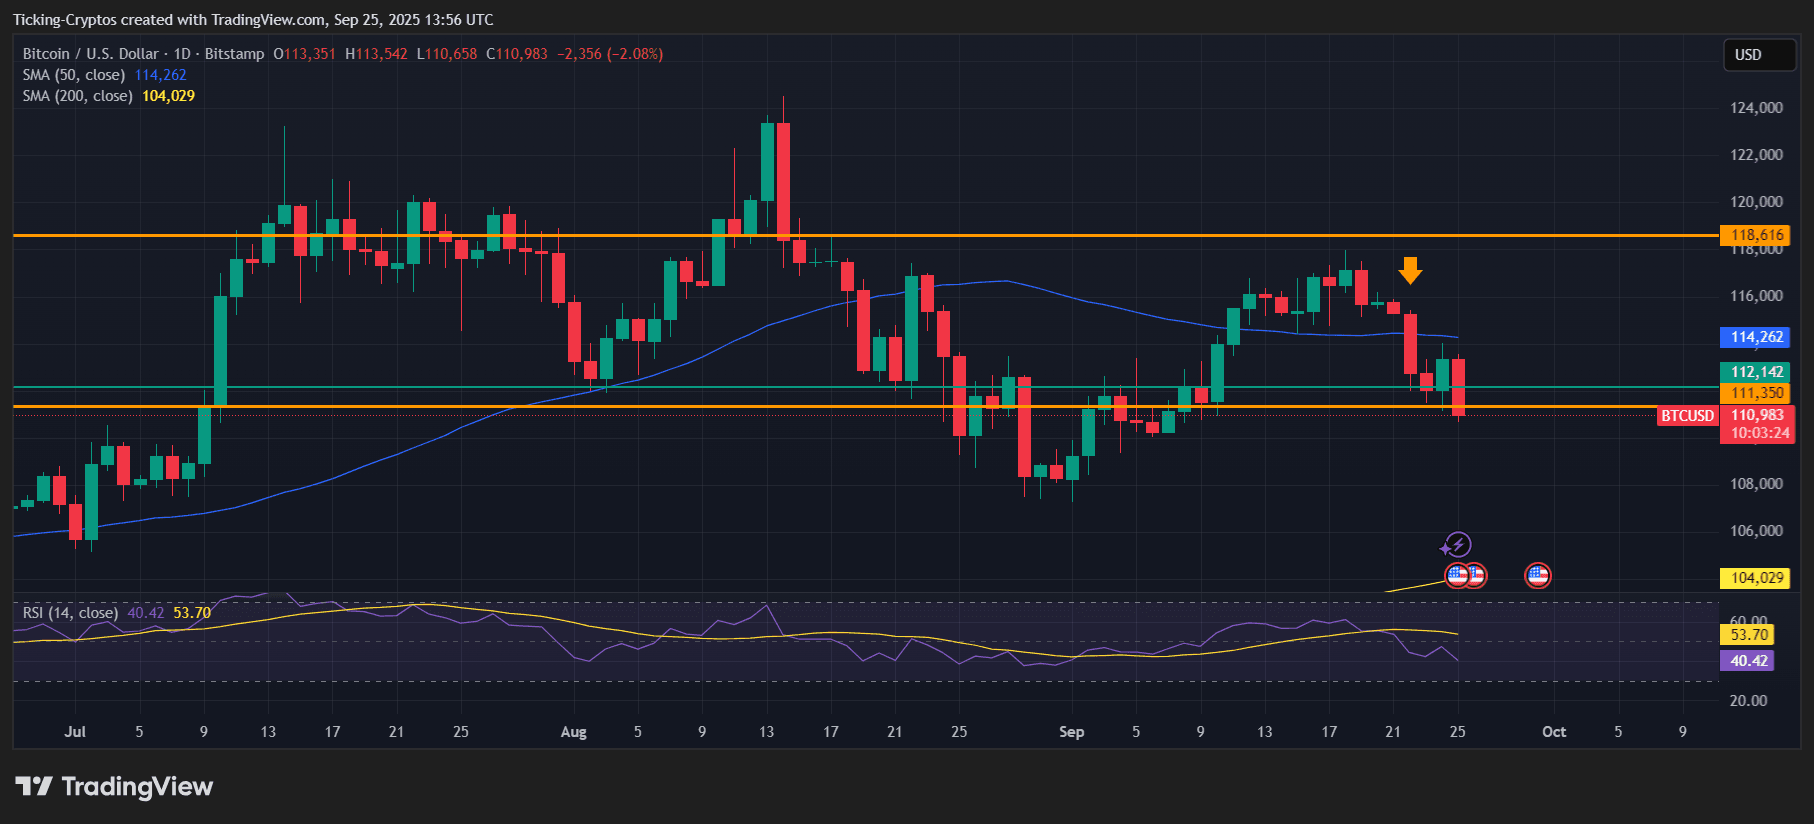
BTC/USD 1-day chart – TradingView
Chart Insights: Support and Resistance Levels
An examination of the daily chart reveals that Bitcoin is positioned just above its key support level at $110,000. Historically, this area has been robust enough to attract buyers and prevent further declines.
Immediate Resistance: $114,200 (50-day SMA)
Major Resistance: $118,600
Key Support: $111,350 (touched intraday)
Critical Support: $110,000
The Relative Strength Index (RSI) hovers around 40.42 indicating bearish trends but also approaching oversold conditions where recoveries are often initiated.
Potential Outcomes Moving Forward
1. Recovery from $110,000
If Bitcoin manages to stay above the crucial level of $110,000 we might witness a technical recovery. Such a rebound could propel BTC back into the range between $114,000 and $116,000 with potential momentum reaching up to $118,600 if supported by trading volume.
2. Significant Decline if Breaching Below $110 , &zero;&zero;&zero;
A decisive close below this critical mark would confirm a breakdown in support potentially leading to accelerated losses for BTC targeting near the 200-day SMA (approximately at &dollar104&commaa&zero&semi). Falling under this point may incite panic selling paving way for an extended downward trend cycle..