The Bitcoin (BTC) Rainbow Chart projects a spectrum of possible price levels for February 1, 2026, based on a logarithmic growth model designed to reflect long-term adoption trends rather than short-lived market fluctuations.
Examining the chart reveals that the lowest tier, labeled “Basically a Fire Sale,” indicates severe undervaluation linked to capitulation and strategic accumulation over time. This positions Bitcoin between $40,864.57 and $53,396.65 on the specified date.
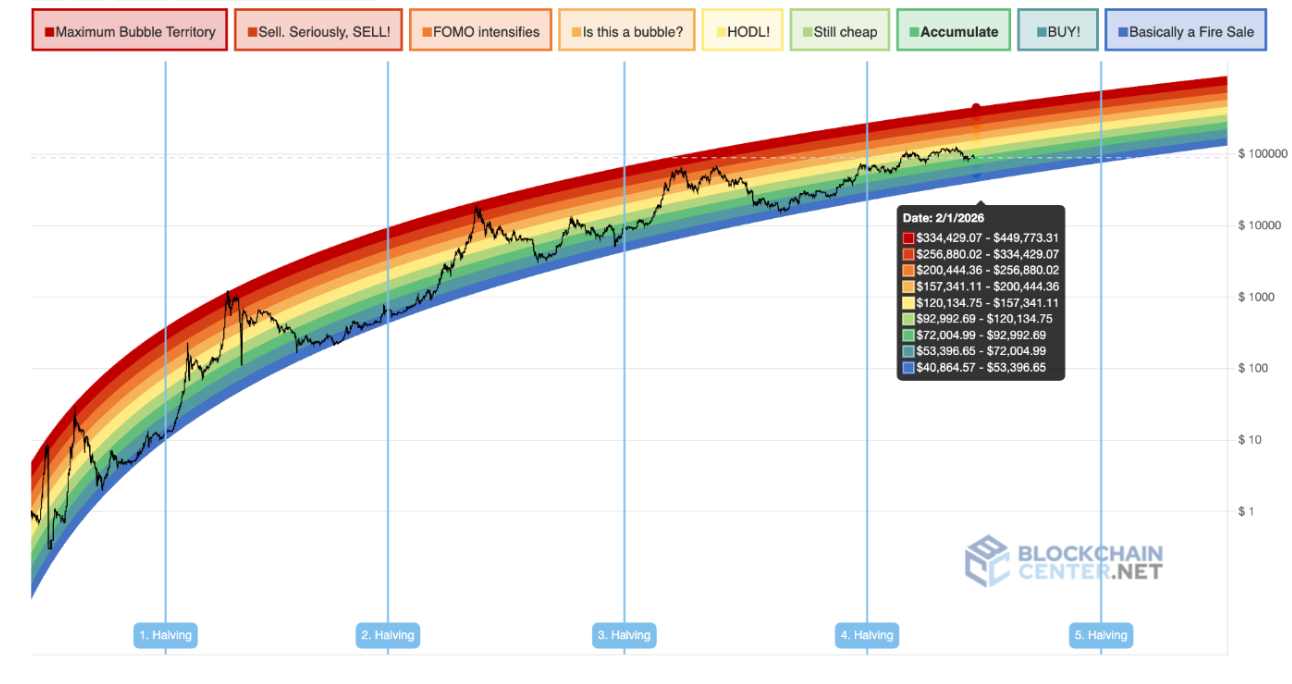
Moving upward, the “BUY!” zone signifies deep undervaluation accompanied by improving market sentiment and historically favorable entry points for long-term investors. This range spans from $53,396.65 to $72,004.99.
Above this lies the “Accumulate” segment where Bitcoin is still considered undervalued but showing signs of stabilization—ideal for gradually increasing holdings within a price band of $72,004.99 to $92,992.69.
The next level called “Still cheap” suggests that as awareness expands broadly across markets and communities alike, Bitcoin remains attractively priced between $92,992.69 and $120,134.75.
The “HODL!” region reflects fair valuation consistent with Bitcoin’s sustained growth trajectory over time—encouraging holders to maintain their positions rather than aggressively buying or selling—ranging from $120,134.75 up to around $157,341.11.
Beyond this threshold is the “Is this a bubble?” zone which captures heightened speculation coupled with increased volatility in prices ranging from approximately $157K to just over $200K ($157,341.11–$200,444.36).
The subsequent band named “FOMO intensifies” represents momentum-driven price surges that outpace fundamental value assessments within roughly a range of $200K–$256K ($200,444.36–$25688002).
Following that is the warning zone titled “Sell. Seriously, SELL!” which signals historically overheated conditions carrying significant downside risk between about $256K and $334K ($25688002–$33442907).
At its peak lies the extreme valuation area called “Maximum Bubble Territory,” ranging from roughly $334K to nearly half-a-million dollars at ~$44977331 — representing unsustainable speculative frenzy expected by early 2026.
Bitcoin Price Outlook
As of January 24th trading near approximately US$89,300, , BTC currently sits close to upper bounds within its “''<em>Accumulate”''</em> band.
If BTC maintains adherence toward this long-range trend without entering euphoric territory, a shift into “''<em>Still Cheap”''</em> might occur by early 2026 — suggesting potential prices falling anywhere between approximately US&amp;amp;amp;amp;euro;&euro;$93,k – US€$120k.(
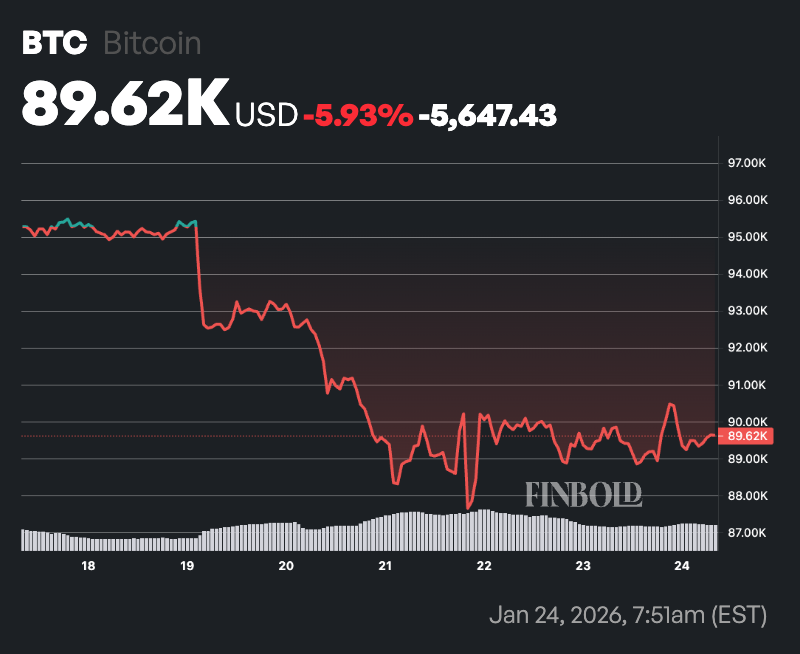
Technical indicators reveal BTC trading slightly below its 50-day simple moving average (SMA) at around US€$90,k while remaining well under its longer-term benchmark—the 200-day SMA near US€$105k.
This configuration hints at short-term softness alongside diminished momentum in broader terms.
The Relative Strength Index (RSI) measured over two weeks stands near neutral territory at ~42&period8 but leans toward bearish bias indicating some easing selling pressure yet insufficient strength exists for confirming robust bullish reversal signals.
(Image credit: Shutterstock)