Bitcoin currently stands at $89,907, boasting a market capitalization of $1.79 trillion and an impressive 24-hour trading volume of $45.09 billion. Despite fluctuating between $88,532 and $90,788 during the day, the price action suggests more of a cautious pause than an explosive breakout.
Analysis of Bitcoin’s Price Movement
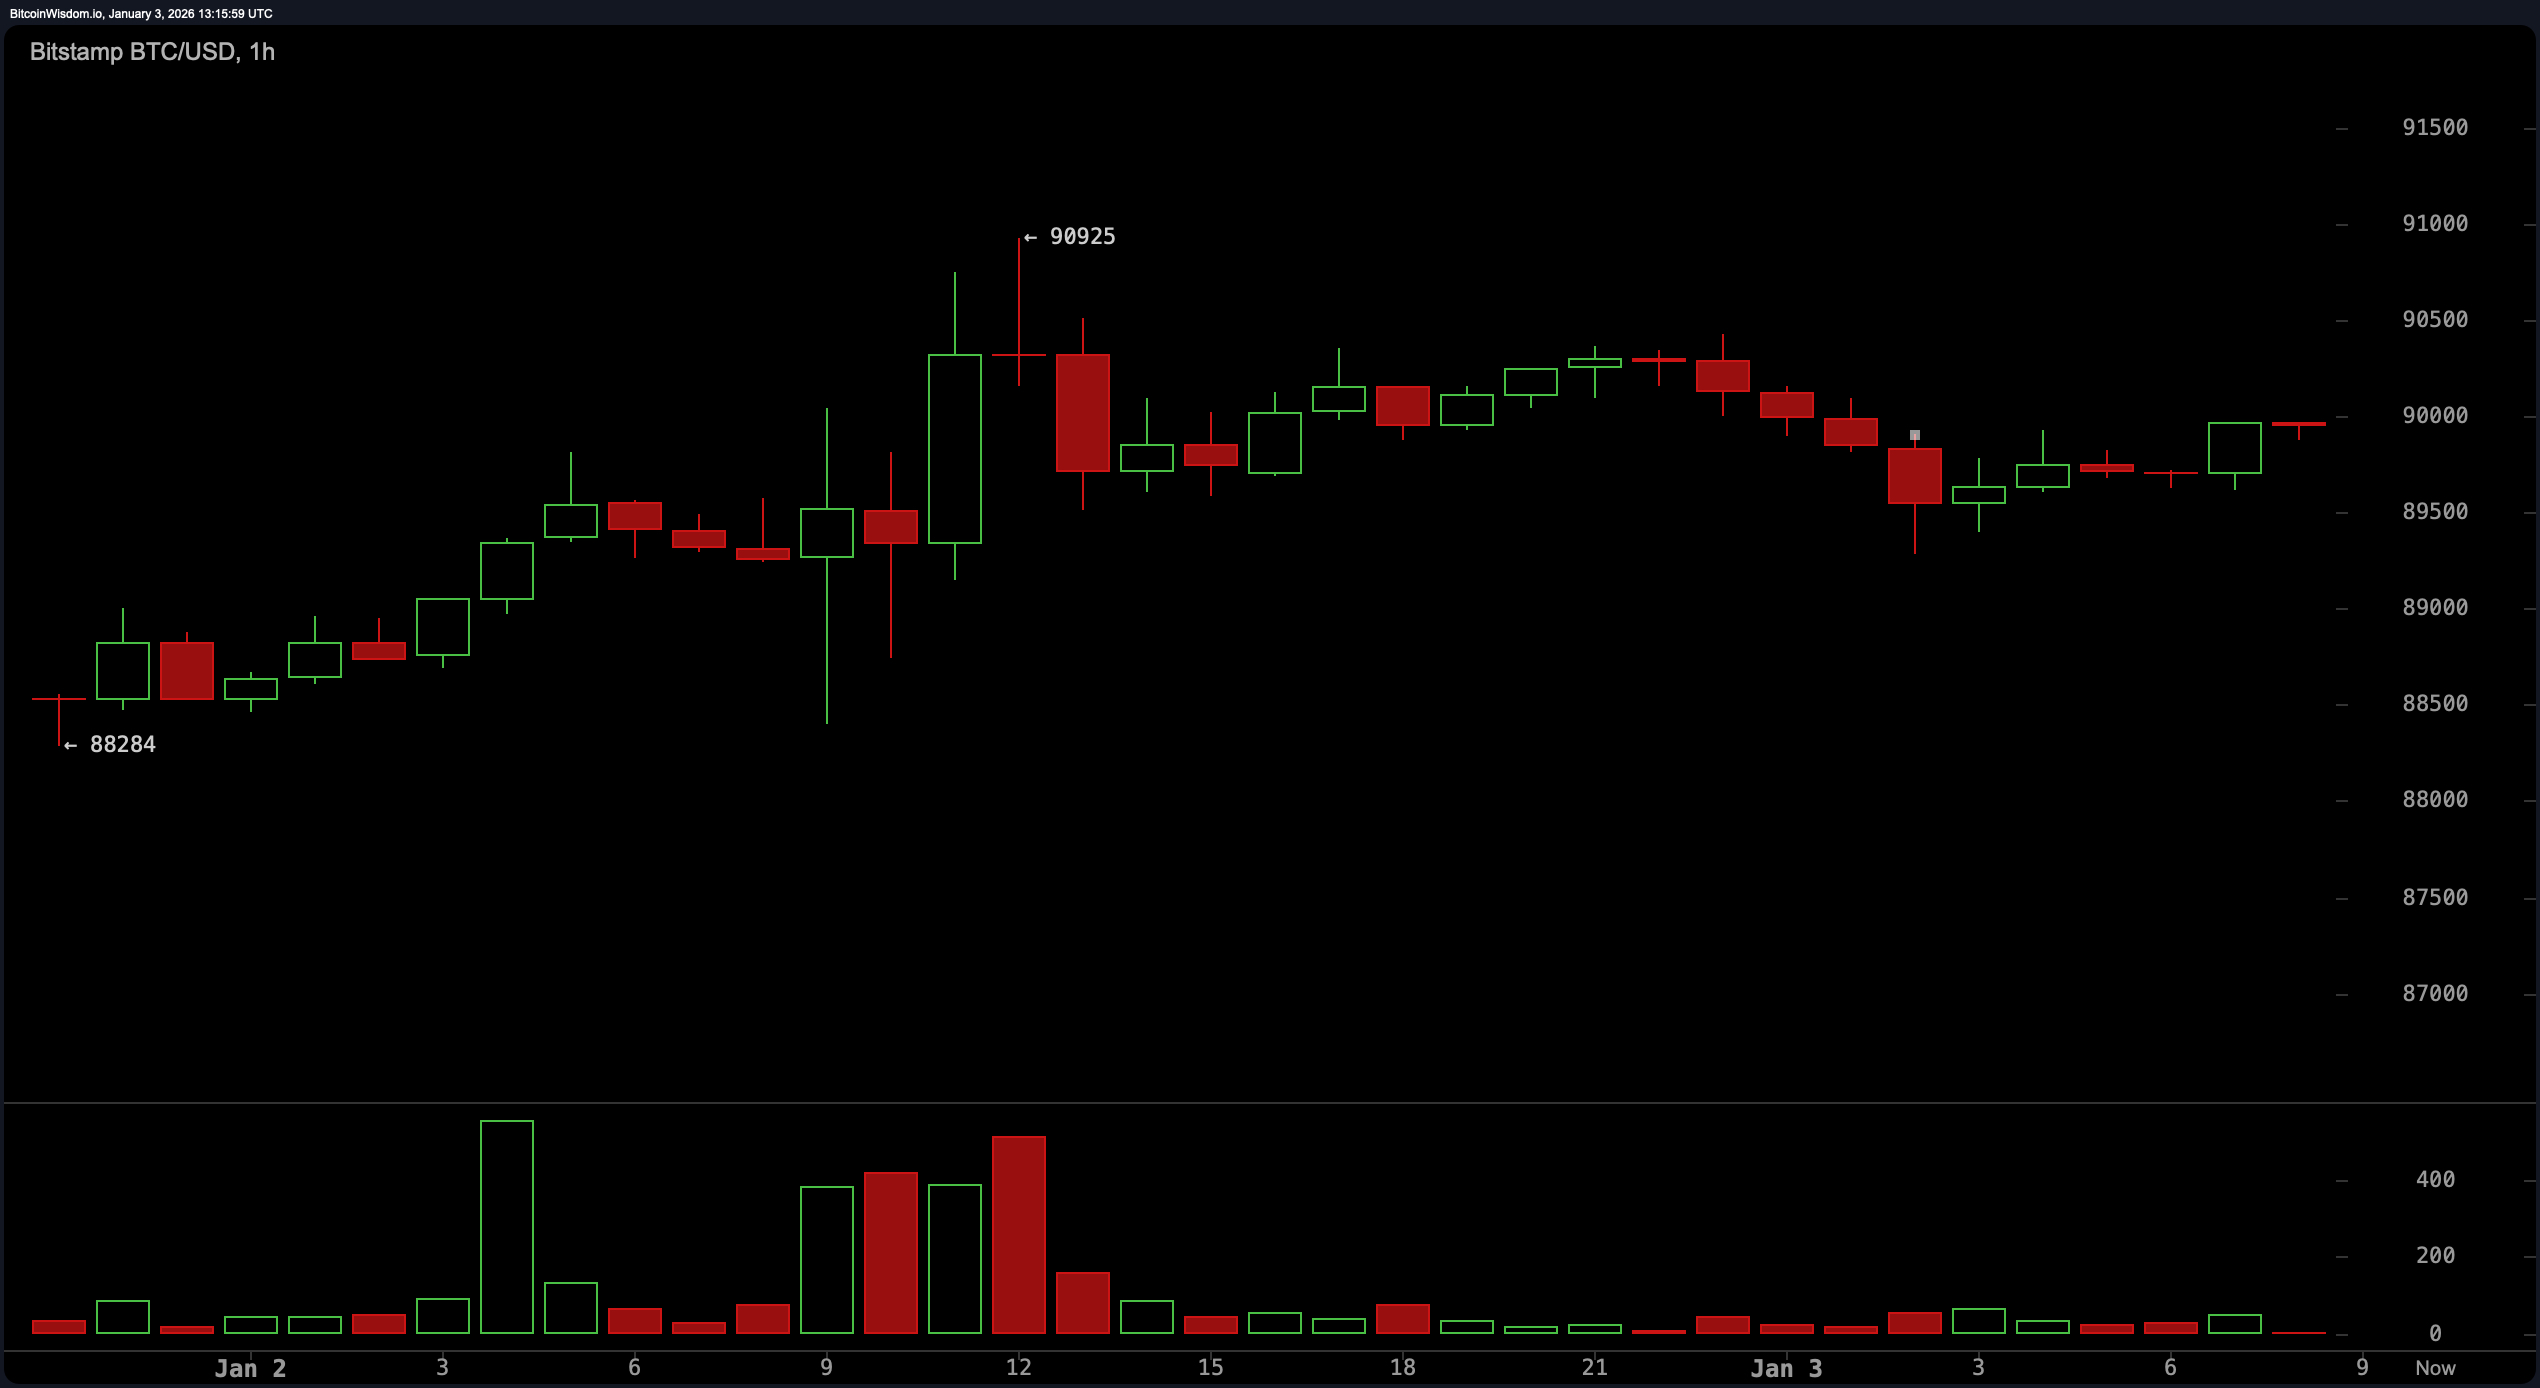
Examining the 1-hour chart reveals bitcoin oscillating nervously between support around $88,500 and resistance near $91,000. Volume spikes occur briefly when prices approach the upper boundary but are quickly met with selling pressure—akin to a hesitant dance partner stepping back.
The optimal strategy appears to be entering positions within the range of approximately $88,800 to $89,200 while maintaining vigilance for any breakdown below roughly $88,300. Exiting trades near resistance levels from about $90,300 up to just under $90,800 is advisable unless buyers gain enough momentum to push decisively beyond this ceiling.
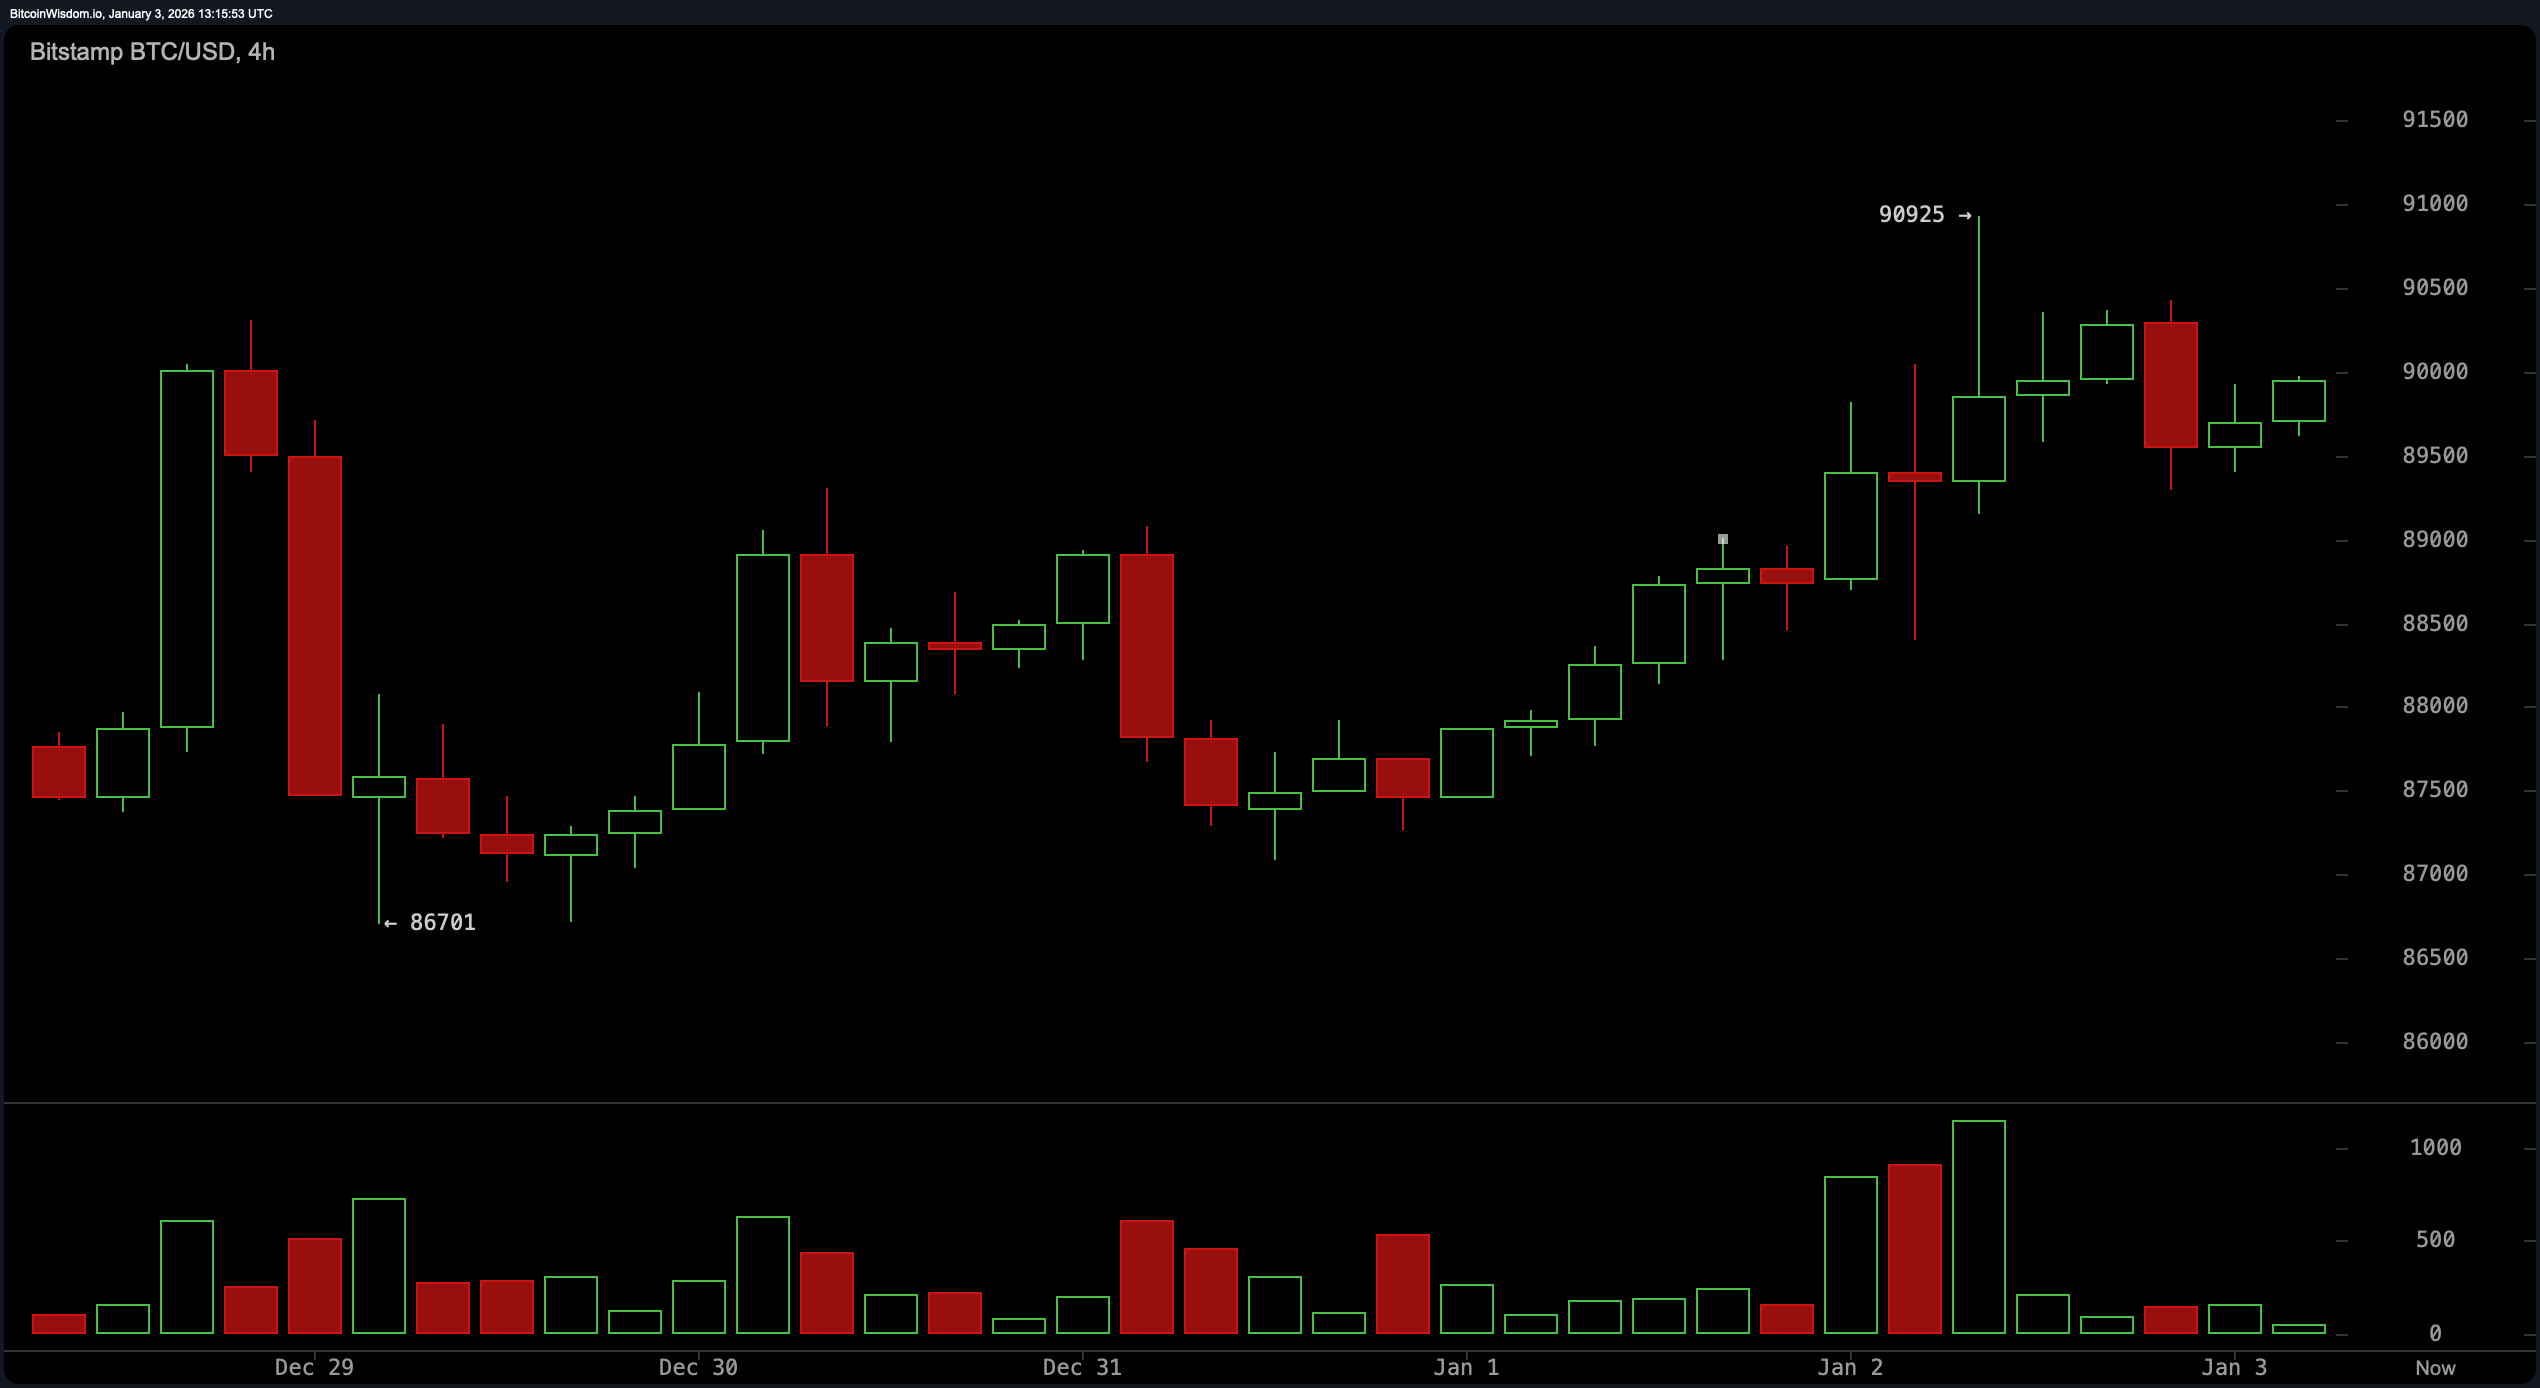
On a broader scale reflected by the 4-hour chart since January 1st, bitcoin shows tentative optimism by forming higher highs and higher lows—a positive sign though not entirely convincing yet. Support levels are defended with moderate enthusiasm while repeated attempts to break above around $90,900–$91,000 have been unsuccessful so far.
A drop beneath approximately $87,500 could undermine this fragile upward trend; traders should keep this critical level in mind as they navigate current conditions.
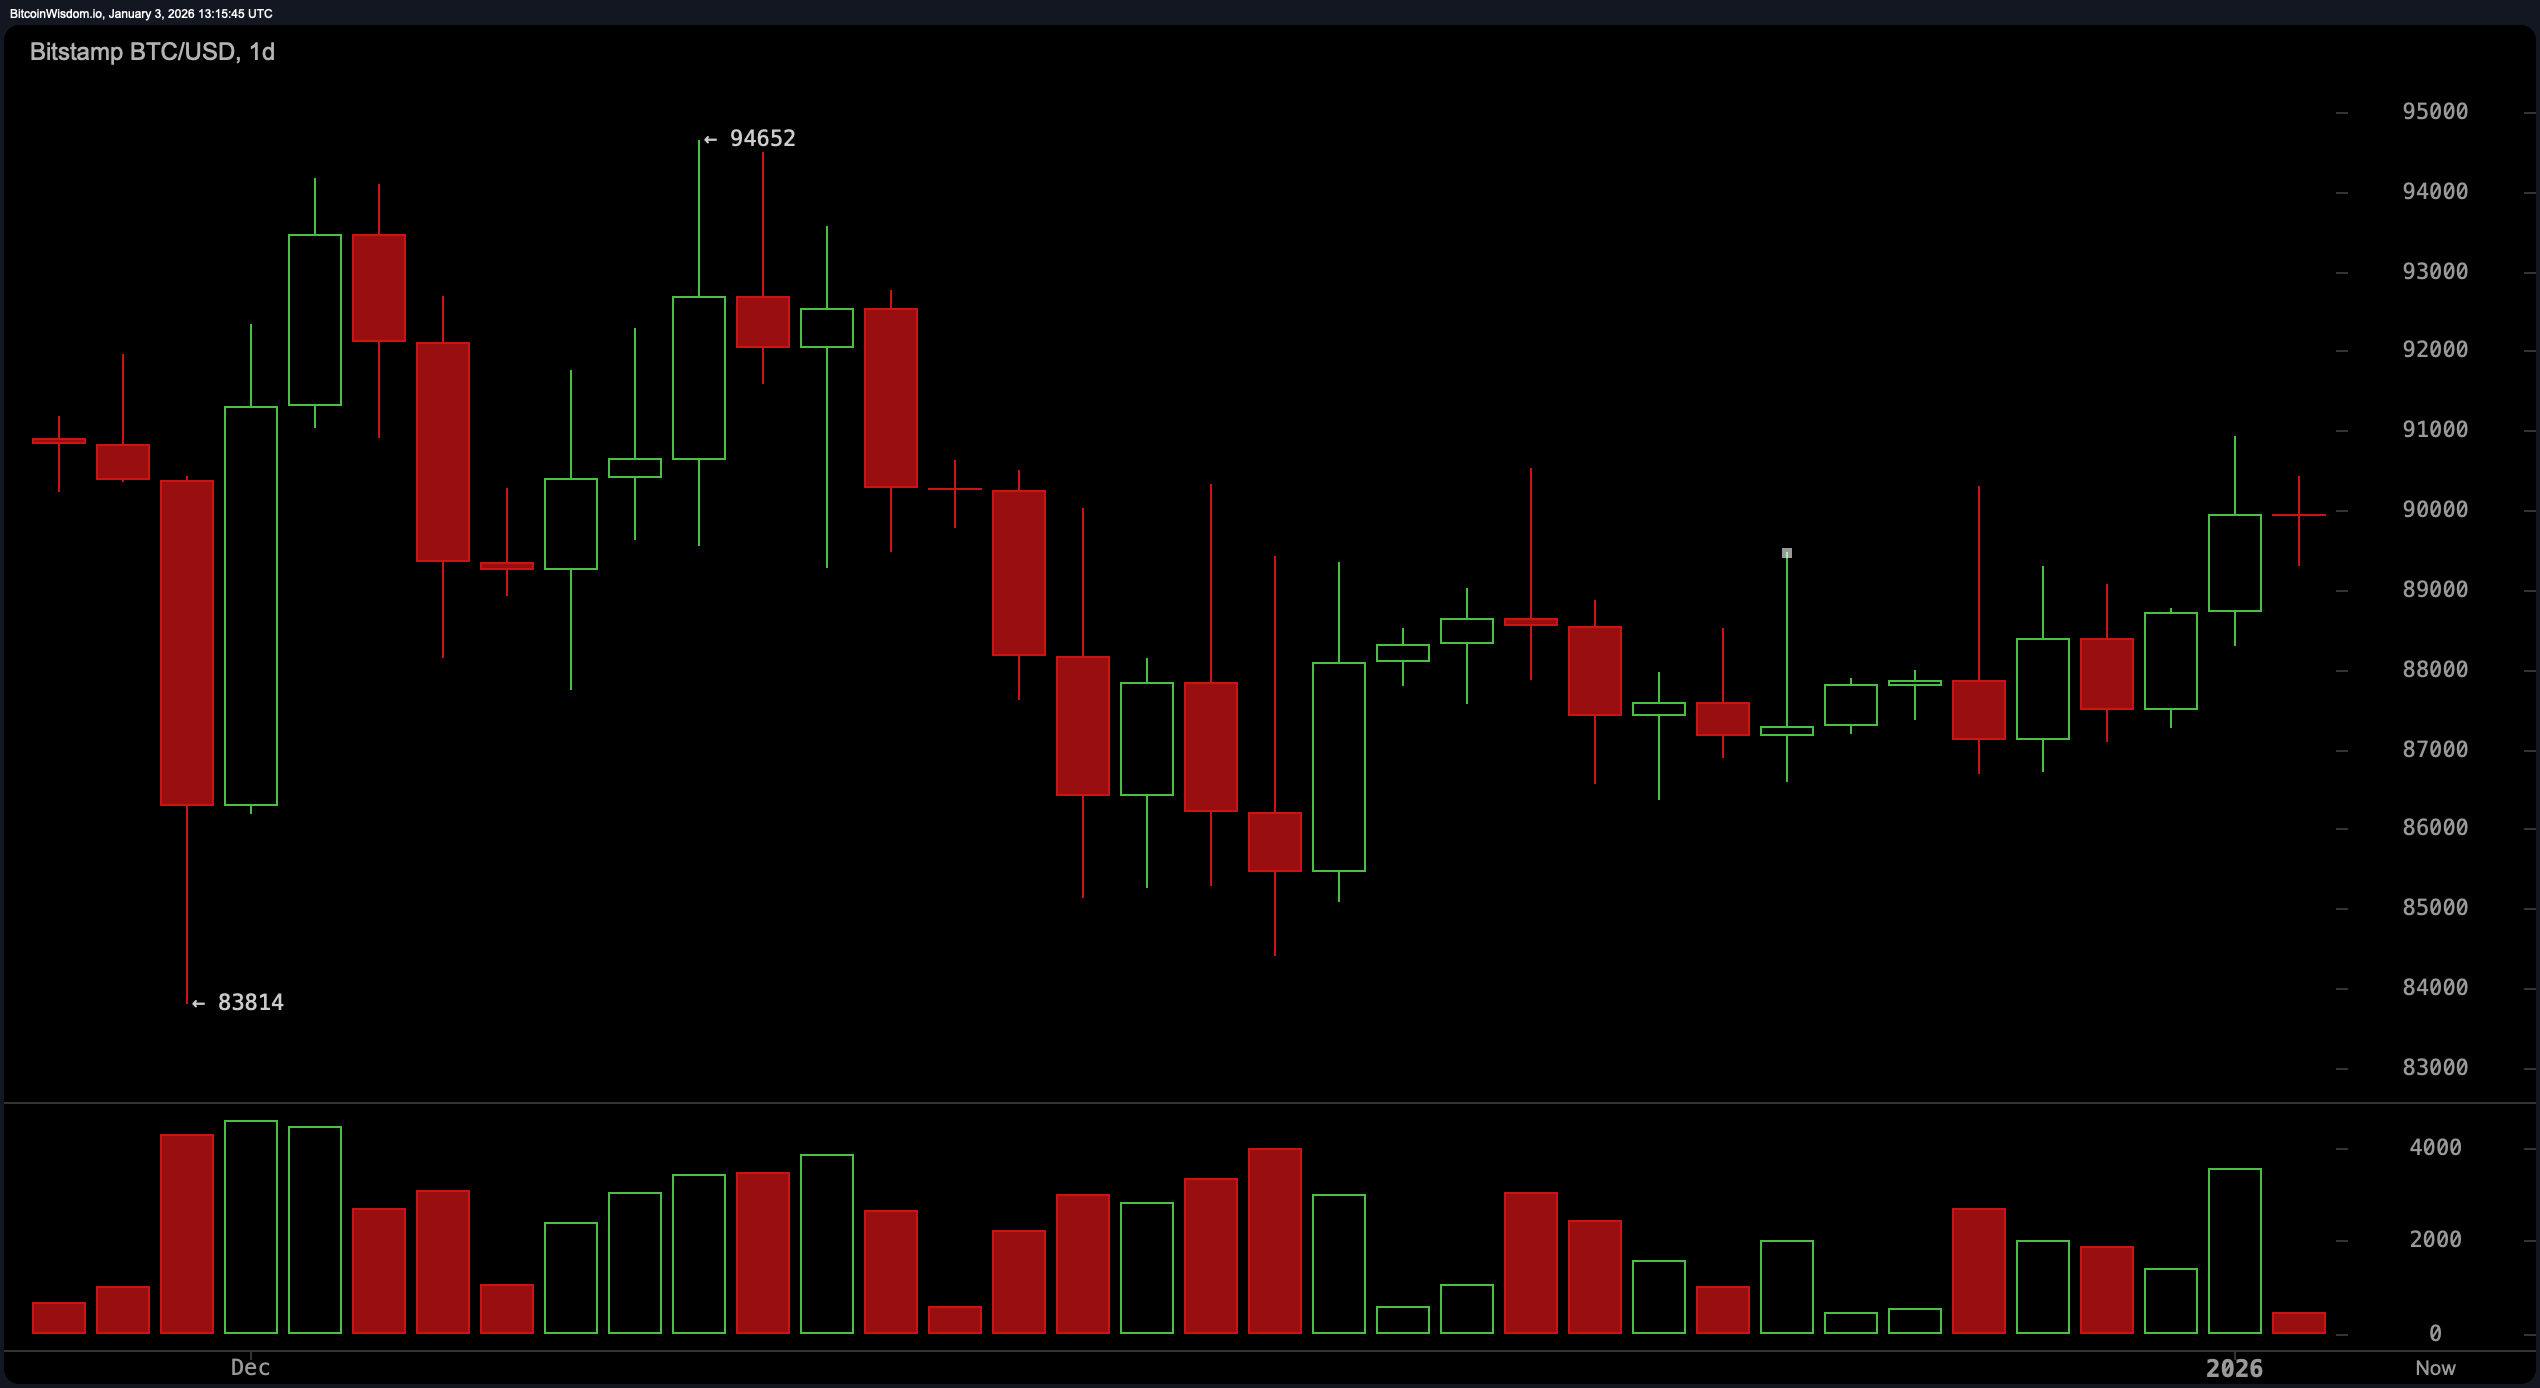
The daily timeframe paints bitcoin as patient rather than impulsive: it comfortably occupies the upper half of its recent range between about $84,000 and $95,000.
The price remains well above December’s low near $83,800 but has yet to reclaim territory close to its recent high zone around $94,500–$95,000.
Without a strong daily close outside roughly $86,000–$92,000, a continuation within this sideways channel seems likely for now.
Technical indicators echo this indecision: The Relative Strength Index (RSI) sits neutrally at about 54 while Stochastic oscillator readings hover near 74 — neither signaling overextension nor oversold conditions.
The Commodity Channel Index (CCI) at +209 alongside momentum figures pointing downward suggest some bearish undertones but lack sufficient strength to dominate overall sentiment.
The Moving Average Convergence Divergence (MACD) registers -410 hinting quietly toward potential upside recovery whereas Awesome Oscillator values remain subdued around -370 reinforcing neutrality across indicators.
Moving averages present mixed signals too: short-term EMAs &&smooth simple moving averages like those calculated over periods such as ten or twenty sessions lend mild support for current pricing levels.
Conversely,&br />'s medium-to-long term EMAs including fifty-, one hundred-, and two hundred-periods reflect skepticism by positioning themselves significantly above today's prices.
This divergence leaves decision-making split among analysts with bulls needing stronger evidence before confidently advancing their case.
''''''
u201CIn summary,u201Dnn
nBitcoin remains locked inside its established boundaries without revealing clear directional bias just yet.nTraders would do well focusing on nimble entries/exits until either sustained breakthroughs beyond ~$92K or decisive falls below ~$87K materialize.nnn
Bullish Perspective:
nn
nShould Bitcoin manage an assertive rally surpassing ~$92K accompanied by robust volume that holds steady,nthe route toward retesting highs in the vicinity of ~$94,500-~95,000 reopens.nShort-term moving averages combined with ascending lows across multiple timeframes imply bulls retain control even if temporarily overshadowed.nnn
Bearish Outlook:
nn
nConversely,na sharp drop below ~$87,000 backed by conviction would dismantle existing range structure shifting focus swiftly toward supports closer $84,000.nwidespread caution signaled through long-term MAs positioned overhead plus oscillators flashing warnings indicate bears may be circling although not charging full force just yet.nthey’re definitely circlingu201Dnrnrn
Frequently Asked Questions ❓
rnr nr n What is Bitcoin’s current price?r n Bitcoin trades at approximately $89,907 as reported January third , two thousand twenty-six . r nr nIs Bitcoin trending bullish or bearish? r nCurrently , it consolidates neutrally within bounds set from roughly $88,532 up through $90,788 .
r nr nWhere are key support & ; resistance zones?
r nsupport lies near $88,300-$89 ,0oo whereas resistance clusters around $90 ,8oo-$91 ,ooo .
r
This content has been encoded into HTML entities per your request.