
A heated discussion is unfolding among bitcoin enthusiasts and skeptics alike: Has the price of bitcoin reached its peak for this cycle?
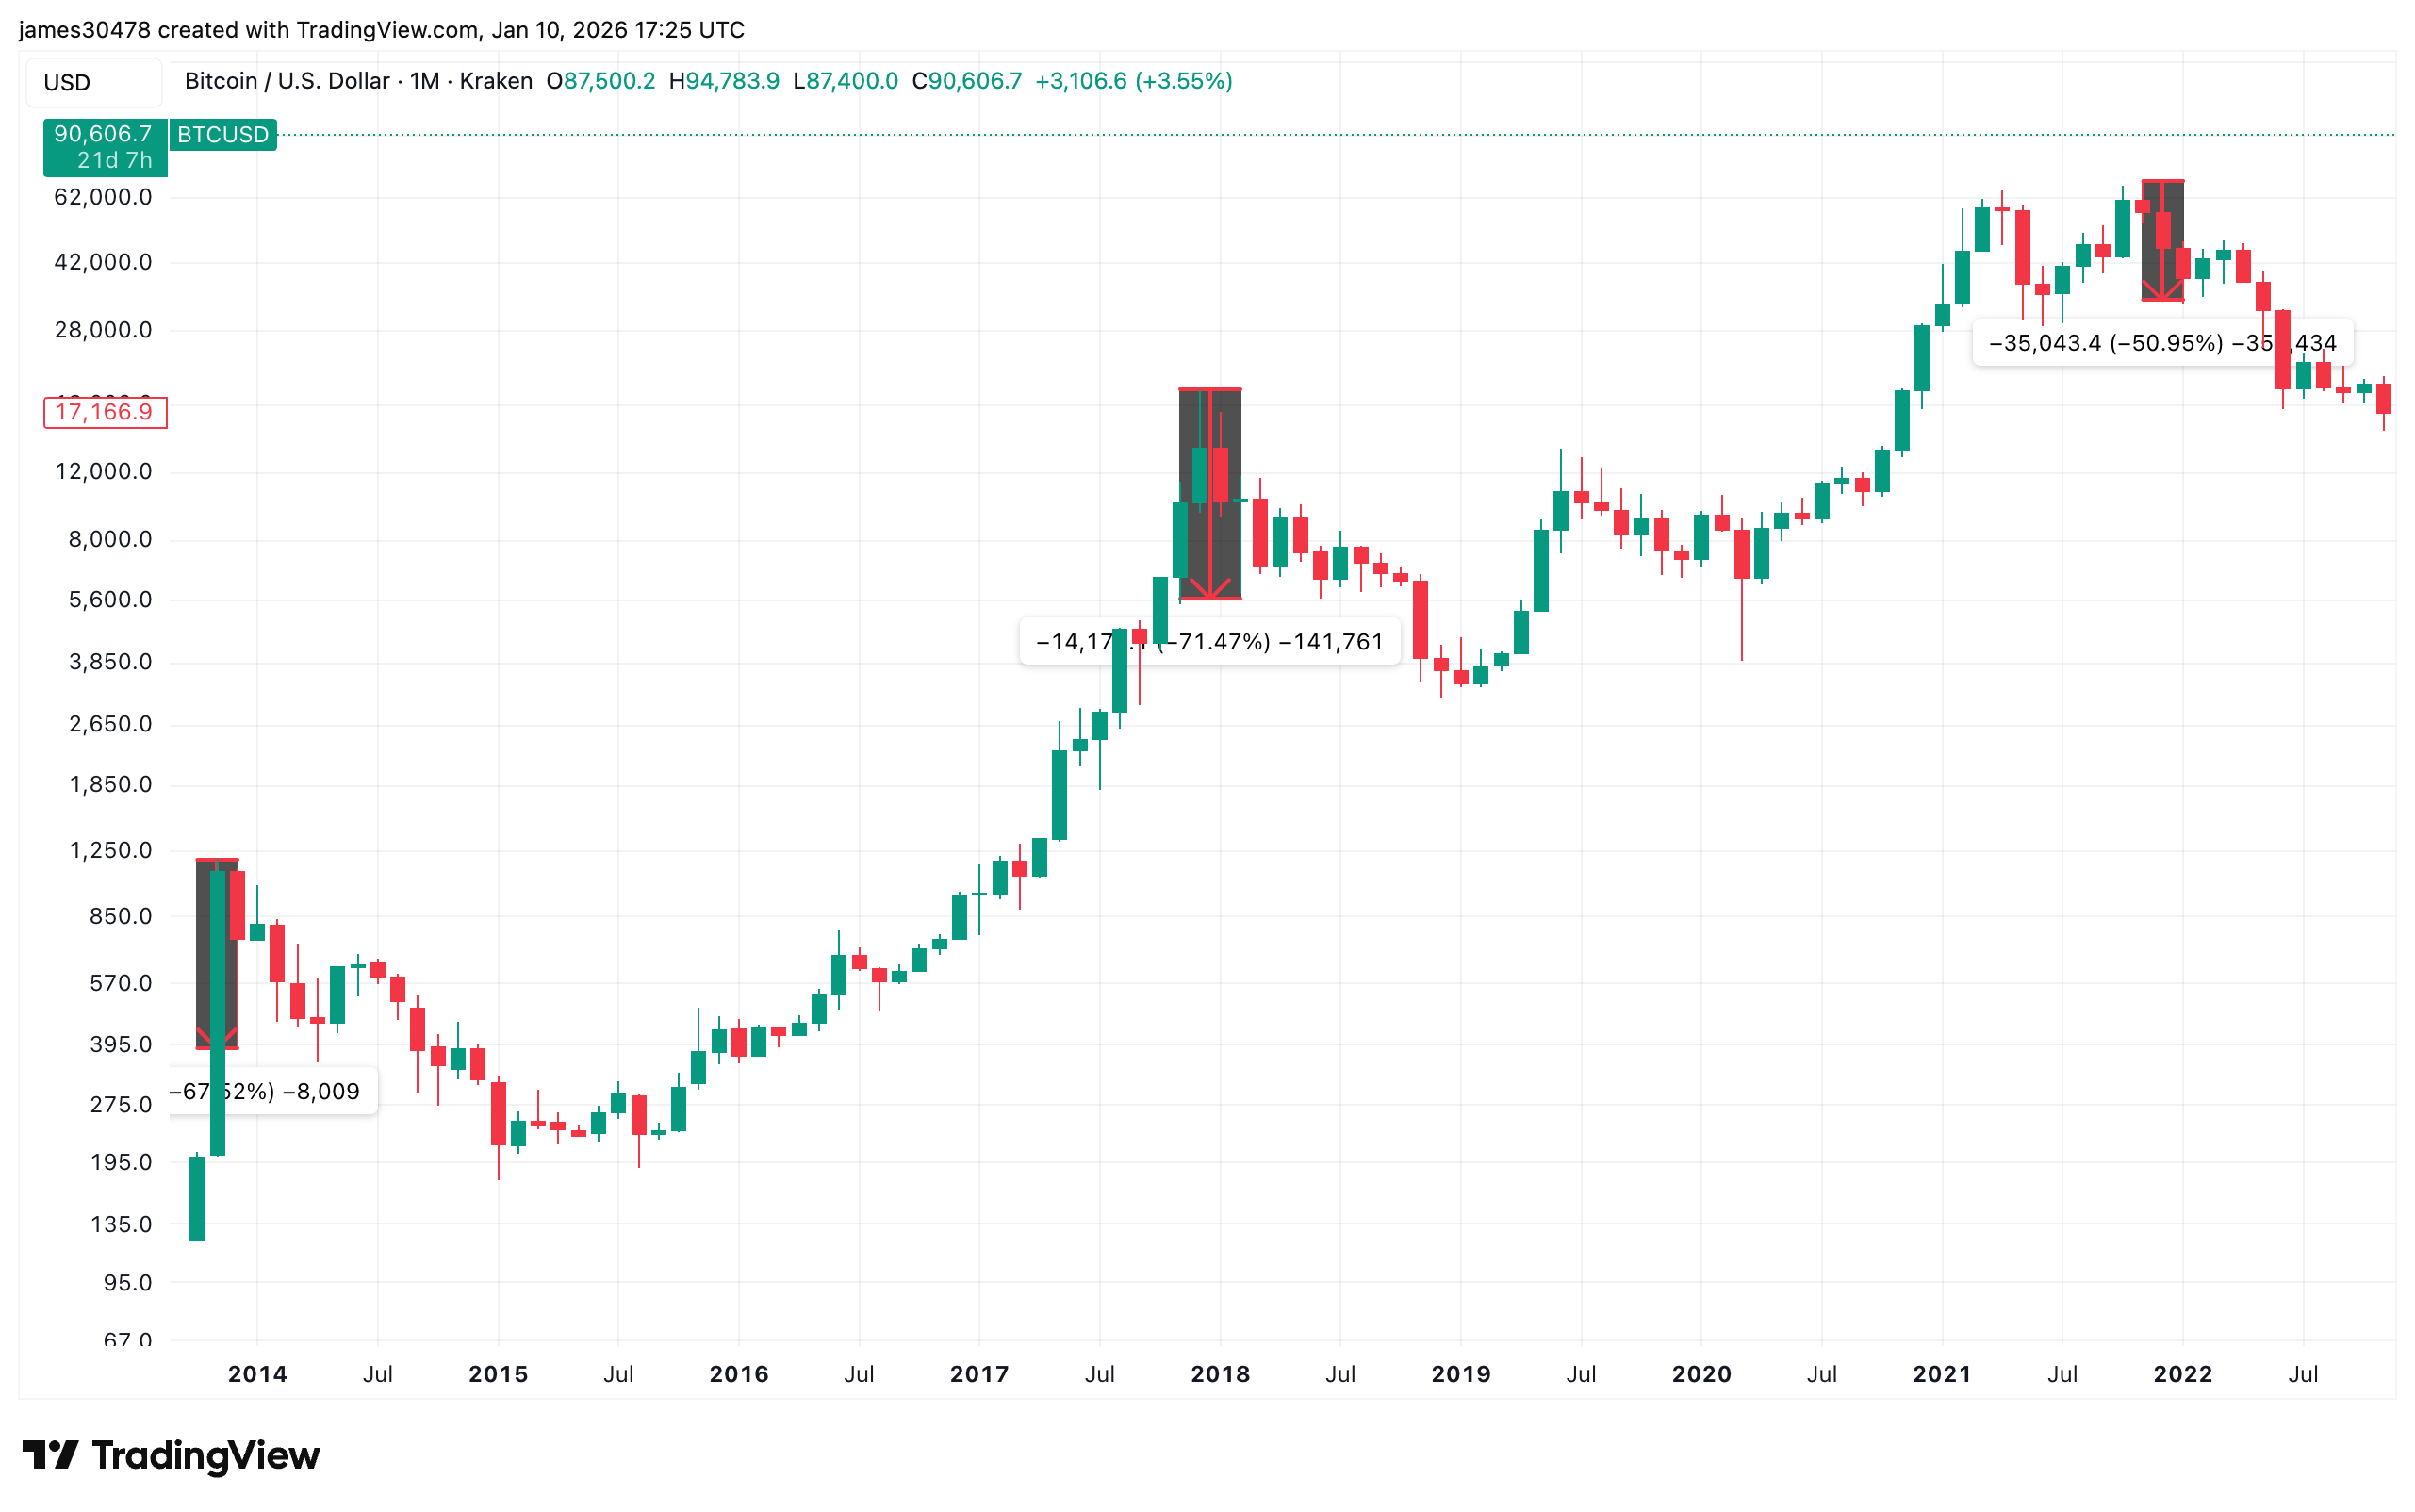
This discourse comes in light of a significant decline in bitcoin’s value, which plummeted from an all-time high of $126,000 in early October to approximately $90,000. This downturn corresponds with the cryptocurrency’s historical trend of peaking around 18 months after each halving event—previous peaks were noted in November 2021 and December 2017, with the next halving anticipated in April 2024. Halving refers to a programmed reduction by half every four years in the rate at which BTC supply expands.
Bearish analysts, encouraged by this timeline, argue that the price has already peaked for this cycle and believe there’s insufficient momentum left for another surge. They predict a prolonged bear market akin to those observed following peaks in both 2021 and 2017.
However, there’s an important nuance that undermines their argument.
While previous euphoric cycles—specifically those of 2013, 2017, and 2021—were indeed followed by year-long bear markets, it’s noteworthy that the most drastic declines typically occurred within the first three months post-peak. For example, after reaching their respective highs during bull runs in recent years (2021 saw a drop of about 51%, while declines were even steeper at around 70% and 71% during similar periods back in both **2017** and **2014**).
This time around though, BTC has seen only a moderate decline; it fell by about **36%** within **90 days** following its peak on October **8**, when it hit $126K.
This sell-off appears more aligned with typical mid-cycle corrections rather than indicative of severe bearish trends.
Many analysts remain optimistic about potential upside as they anticipate continued institutional interest through ETFs could propel BTC to new heights this year—a scenario that might disrupt traditional four-year boom-bust cycles.
 BTCUSD (TradingView)
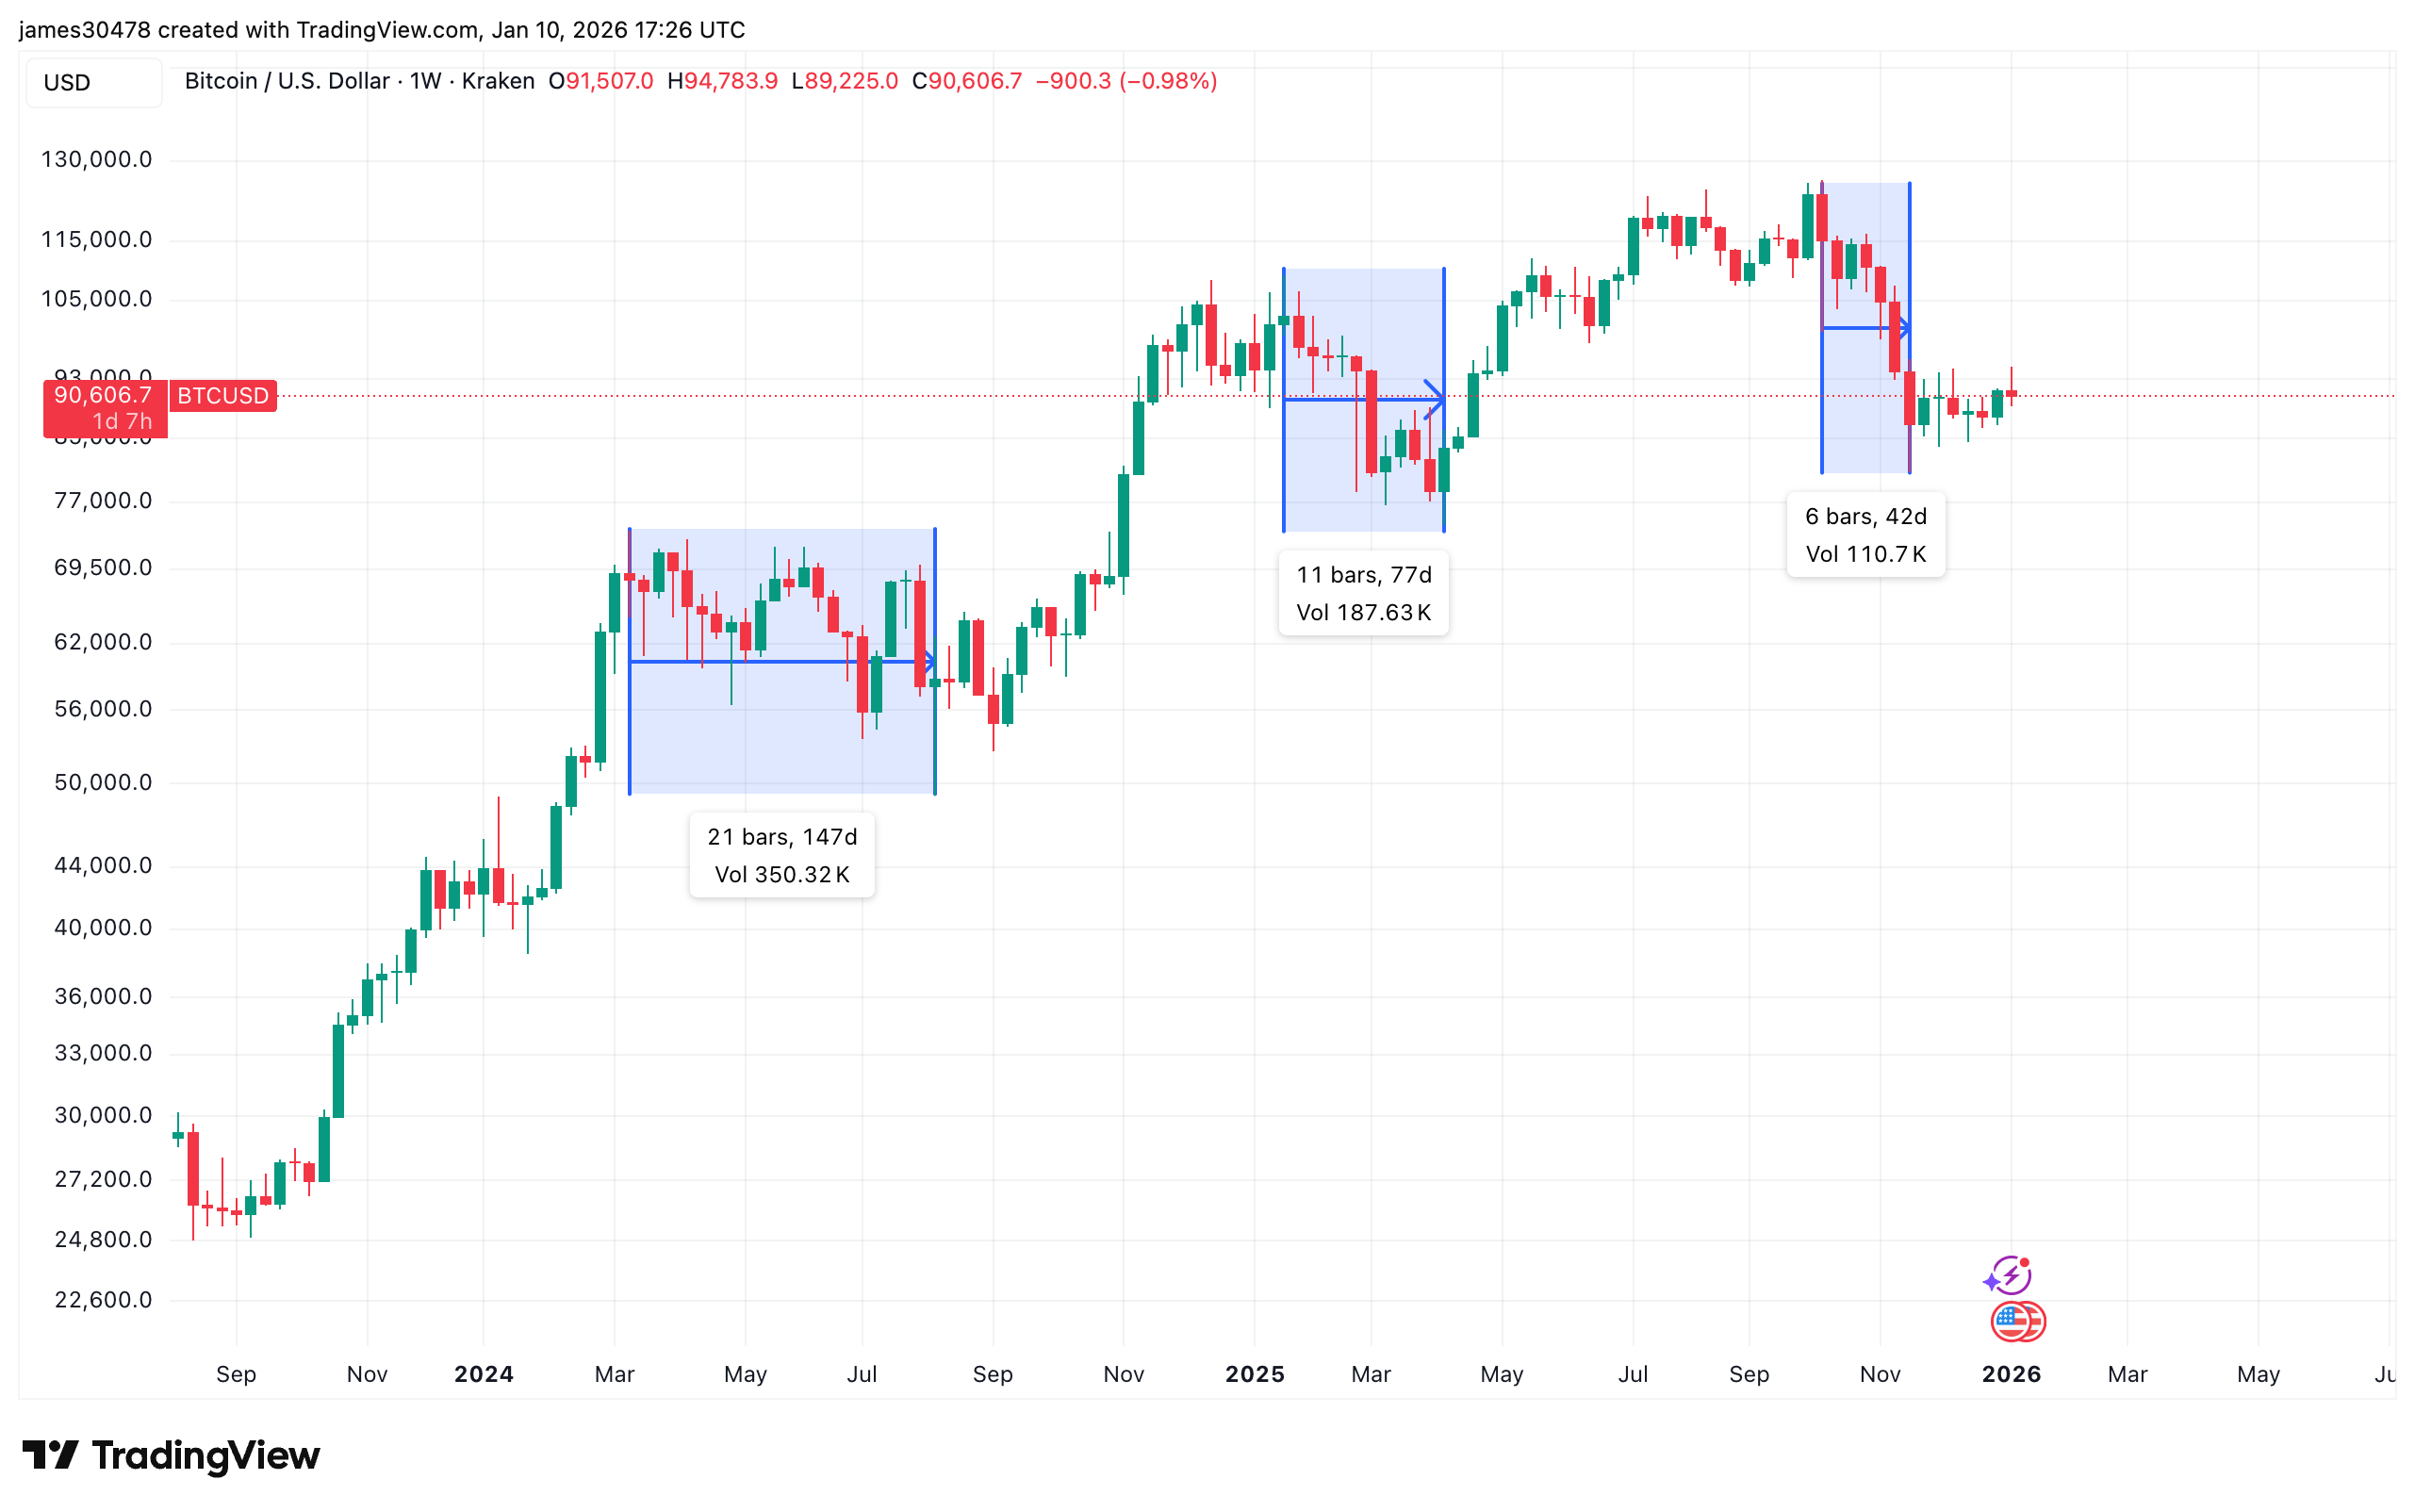
So how does current bitcoin pricing compare against past cycles? Insights may be gleaned from examining how sell-offs have unfolded since early **2023**’s bull run began.
The price has already undergone two significant drawdowns exceeding **30%**, particularly following January’s U.S. spot ETF launch scheduled for late January **2024**. The correction witnessed then persisted over a span of *147 days*, whereas another correction driven by U.S tariffs was recorded lasting *77 days* into *2025*.
The ongoing correction has thus far lasted only *46 days*, assuming we consider $80K as its lowest point reached so far.
In light of these observations regarding drawdown magnitude alongside duration taken for recovery—the current situation bears closer resemblance to earlier mid-cycle pullbacks given less than a *50%* retracement compared against historically steep declines linked with prior cycle tops occurring within initial three-month spans post-peak events
.
Additionally; Bitcoin recently regained its position above its fifty-day moving average set at approximately $89K—a move viewed positively as it indicates buyers are reasserting control over market dynamics while signaling upward momentum shift!
 BTCUSD (TradingView)
The ongoing debate surrounding four-year cycles continues unabated; however data presently suggests what we’re witnessing now is merely temporary pause rather than conclusion regarding Bitcoin rally trajectory! While none possess foresight capable enough predicting future outcomes accurately—it seems prudent investors should adhere closely toward insights derived directly from charts along available data points currently accessible!