Throughout this week, Bitcoin’s price has been confined within a narrow band, while the declining Coinbase Premium Index indicates a potential further drop due to diminishing institutional interest.
Key Highlights
Bitcoin’s daily chart reveals the formation of a bearish pennant pattern.
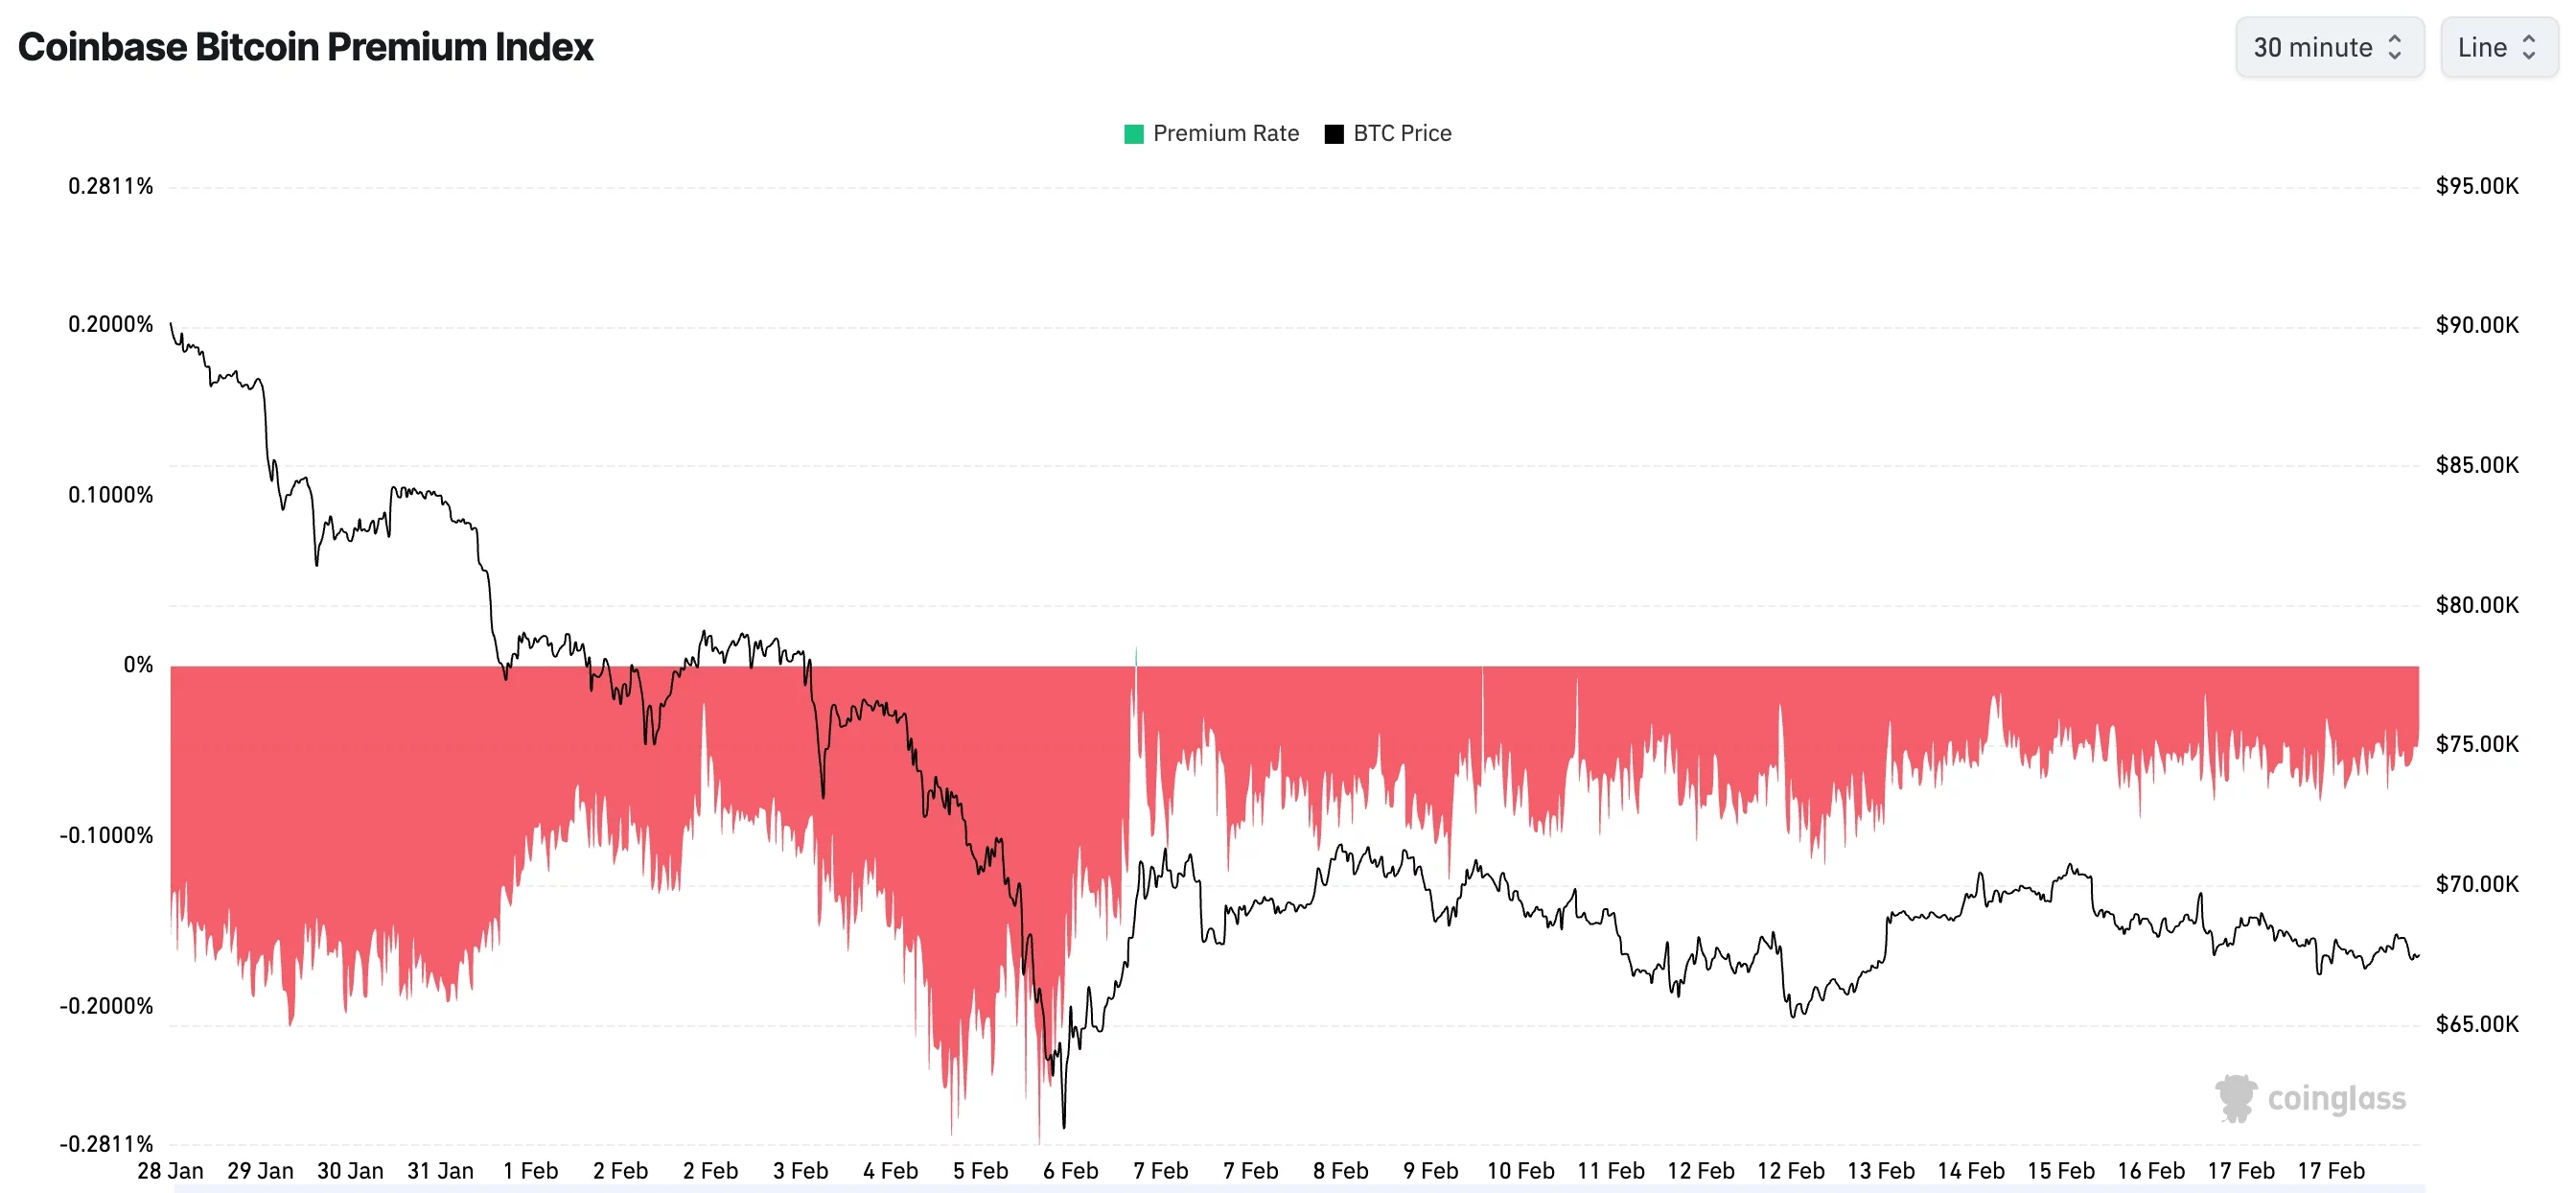
The Coinbase Premium Index remains negative, reflecting weak demand from U.S. investors.
Futures open interest continues its downward trend this month.
On Wednesday, Bitcoin ($BTC) was valued at $67,420, slightly lower than last weekend’s peak above $70,000. This marks a significant decline from its all-time high of $126,300 by more than ten percent.
A critical challenge for Bitcoin is the reduced institutional appetite in the United States. This is evident as the Coinbase Premium Index has stayed below zero throughout 2024. Given that Coinbase is the preferred platform for American crypto investors, this index serves as an important gauge of U.S. market sentiment.
Moreover, only a few companies holding large Bitcoin treasuries are continuing to accumulate coins like they did last year. For instance, Strategy increased its holdings last week to over 717,000 BTC. Similarly American Bitcoin and Strive have made purchases earlier this year.
You might also be interested in: Altcoin spot selling pressure reaches a five-year peak at -$209 billion
Data from SoSoValue highlights that outflows from spot Bitcoin ETFs have surged recently; these funds have collectively lost more than $8 billion since October 2023 with no signs of reversal yet.
Bloomberg reports that many institutions appear disillusioned with Bitcoin because it hasn’t lived up to expectations as an inflation hedge or protection against stock market volatility.
The cryptocurrency also failed to act effectively as insurance against currency devaluation concerns among investors.
The futures open interest on Bitcoin has dropped sharply over recent months and currently stands near $44 billion — less than half compared to last year’s peak exceeding $95 billion. Additionally, borrowing demand on CME futures markets remains subdued during this period.
Technical Indicators Signal Potential Downturn for Bitcoin Price
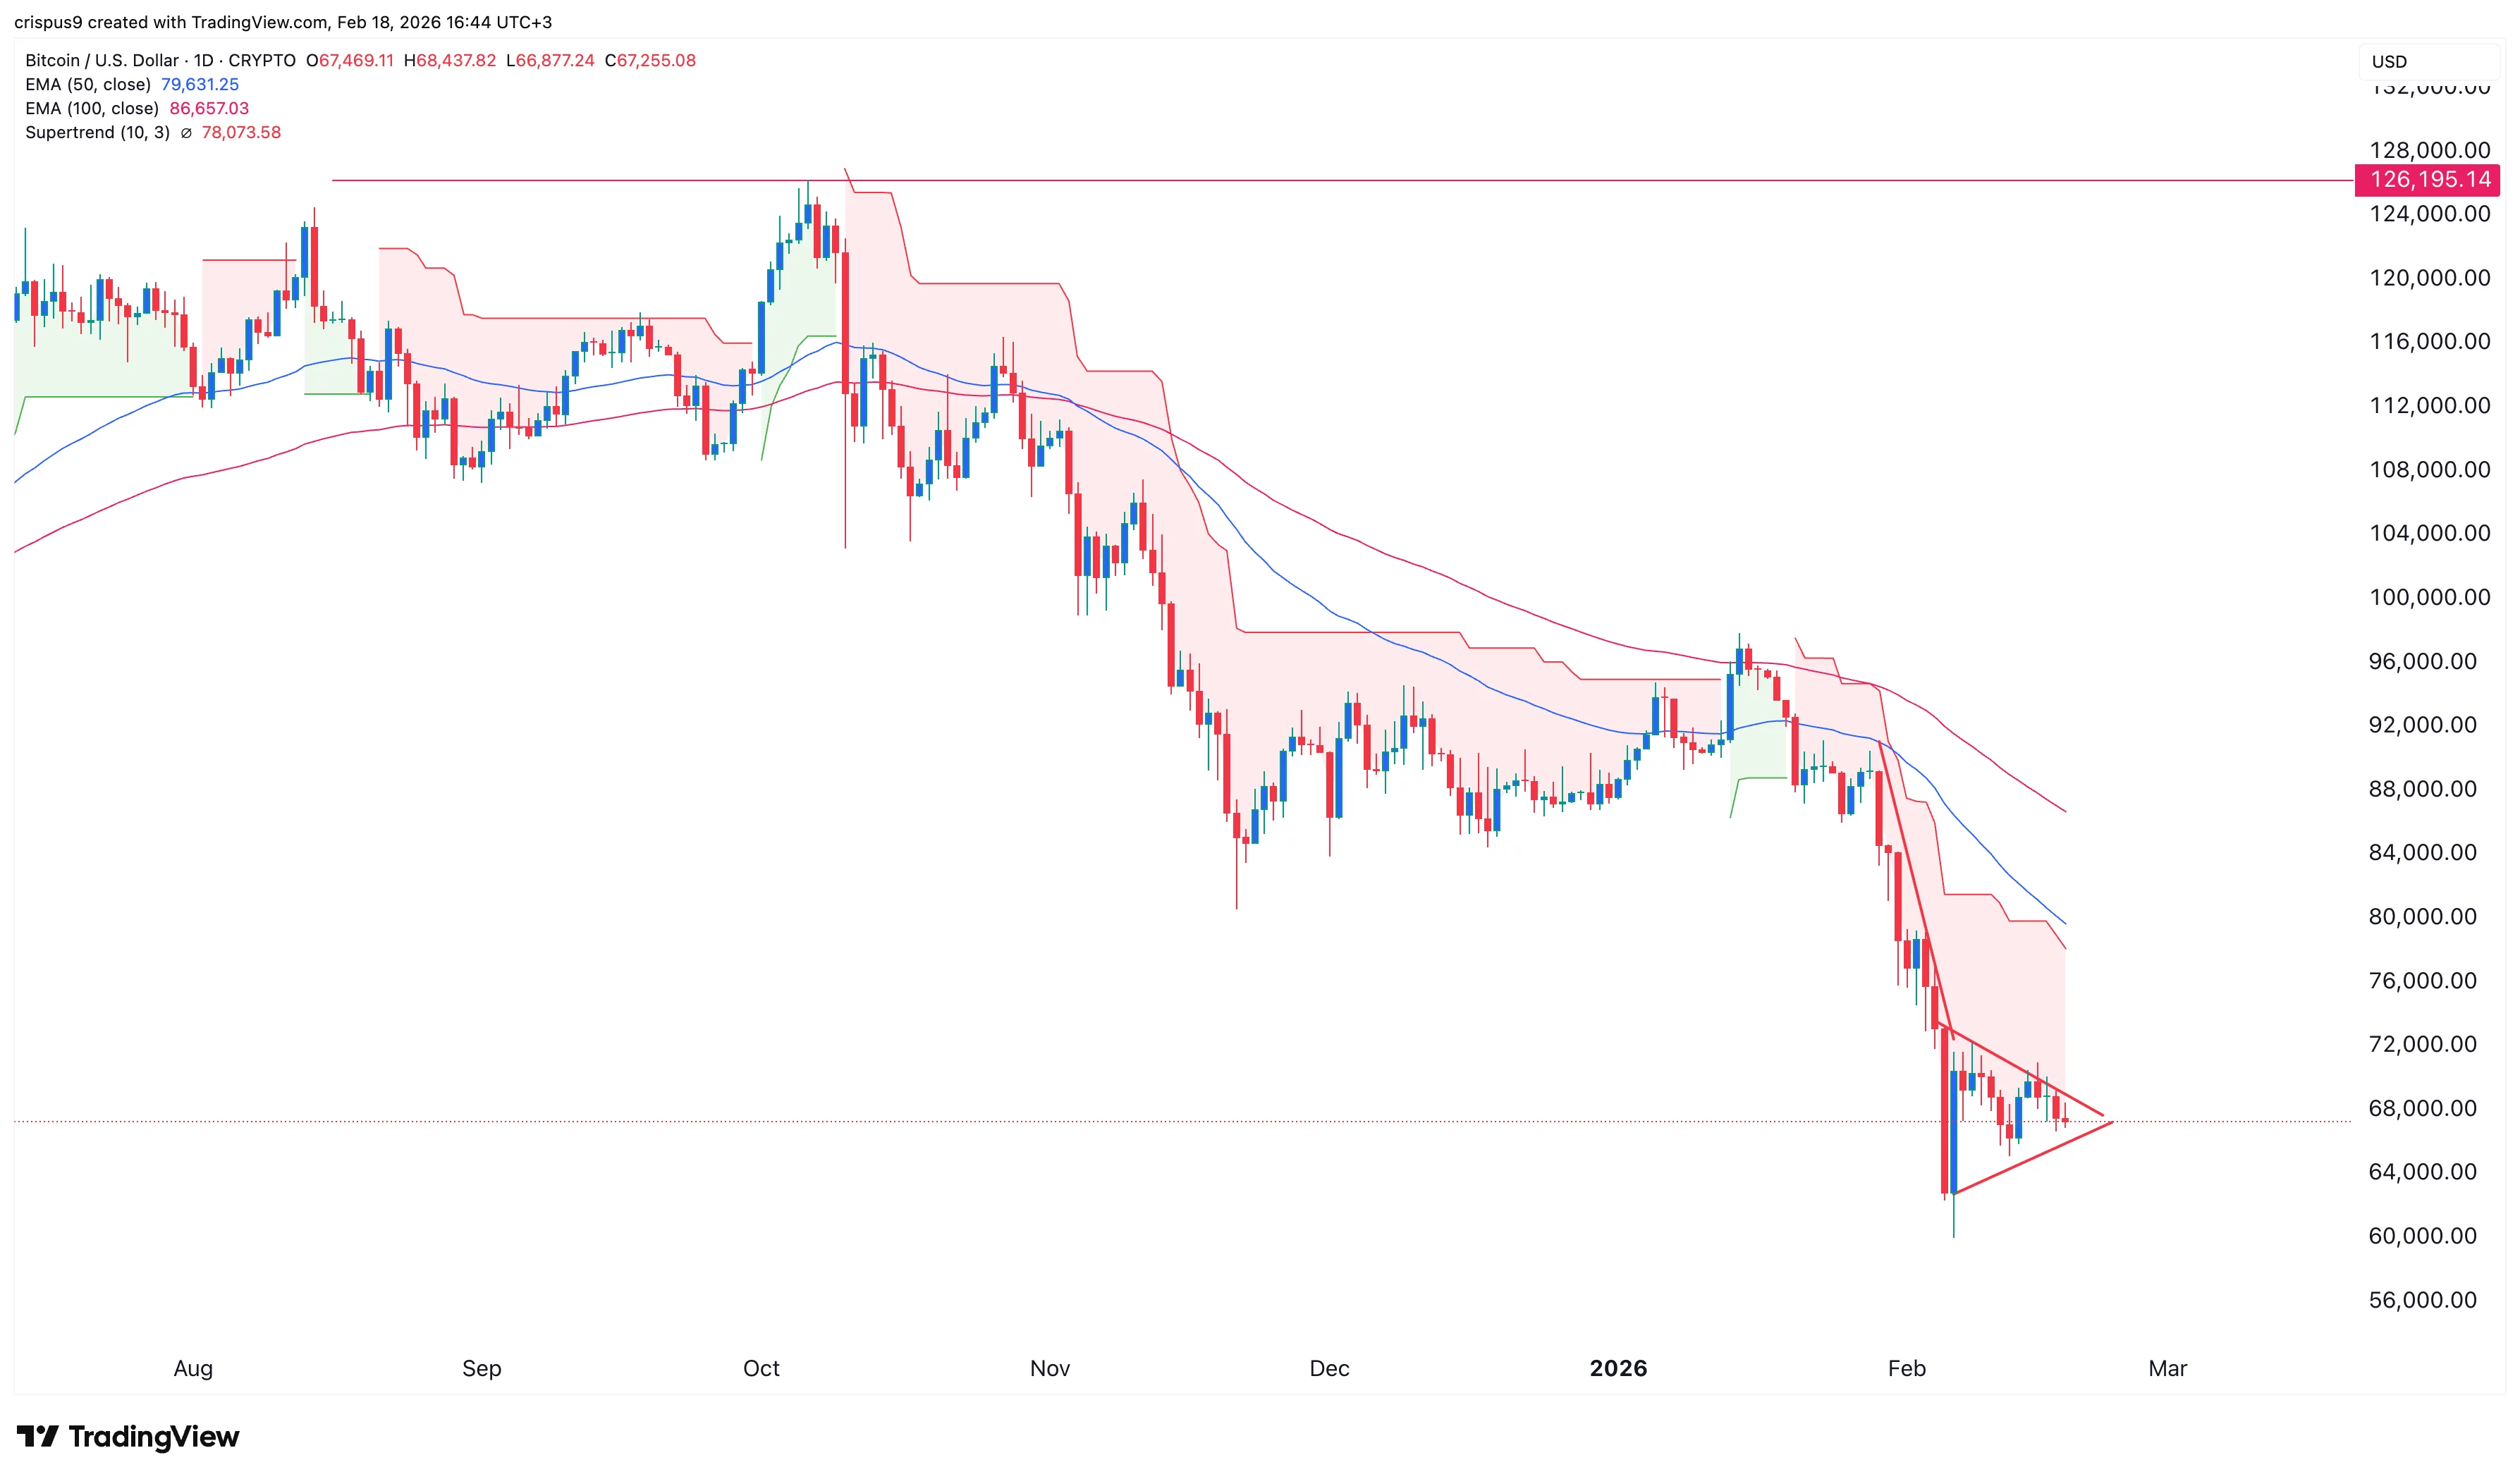
$BTC‘s daily chart exhibits warning signs: it is gradually shaping into an extensive bearish pennant pattern characterized by completing its initial vertical segment and now forming the triangular consolidation phase.
The Supertrend indicator has consistently shown red signals since January 19th and stays below both the 50-day and 100-day Exponential Moving Averages (EMA).
Consequently, downward momentum appears likely with an immediate support test around this year’s low near $60K; falling beneath could pave way toward further declines possibly reaching psychological support close to $50K — aligning with forecasts shared recently by Standard Chartered analysts.
You can read more about: MYX completes strategic funding round led by Consensys.