
Traders in the Bitcoin ($BTC) market are bracing for a potential short-term correction, as a crucial price strength indicator has surged to its highest point in nearly fifteen weeks.
Key Insights:
The “overbought” RSI (Relative Strength Index) for Bitcoin historically signals significant corrections ahead. A breach below the $78,000 support level could trigger a short-term price decline.
Bitcoin Indicators Point to an “Overheated” Market
This week, Bitcoin experienced a remarkable 36% increase, reaching $82,800 from its macro low of $60,000. This rally has notably influenced its daily RSI.
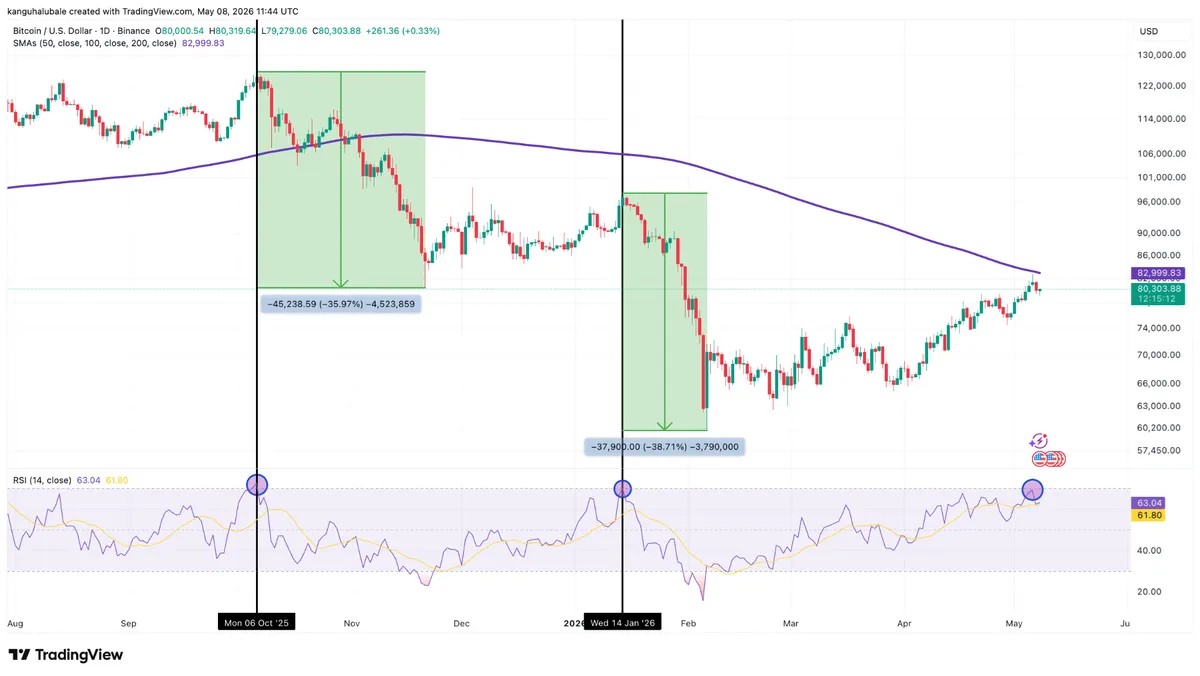
The daily chart indicates that the RSI climbed to 70 on Wednesday from local lows of 39 recorded in March.
“$BTC‘s daily RSI became overbought just as we approached the 200-day EMA,” trader Jelle remarked in a post on X this Friday. He added:
“It’s reasonable to expect resistance at this level.”
$BTC/USD weekly chart. Source: Cointelegraph/TradingView
The RSI is an essential tool for measuring trend strength and includes three critical levels: the oversold boundary at 30, the midpoint at 50, and the overbought threshold at 70. When prices cross these thresholds—depending on their direction—traders can make predictions about future trends. Historically after significant rallies like this one, $BTC tends to correct itself once it enters overbought territory.
Related: Bitcoin bulls aim for $115K by December; does data support this expectation?
An analyst known as Crypto Tice pointed out that such conditions are “rare,” having occurred only four times within the past year; each instance resulted in what he described as a “short-term pullback.” He elaborated:
“Overbought conditions typically do not resolve sideways; they lead to sharp declines.”
An additional analyst named Rekt Fencer noted that during previous occurrences similar to today’s situation, prices dropped between 35%-38%, corroborating his statement with visual evidence from charts above.
Additonally, Bitcoin’s market value-to-realized value (MVRV) ratio—which assesses whether an asset is overpriced—has recently entered into what analysts deem an “overheated zone.” Analyst FrankAFetter stated:
“For the first time since November of last year,
$BTC has surpassed overheated levels according to short-term holder Bollinger Bands.”
$78K Support Level Becomes Crucial for $BTC’s Price Action
The consensus among traders is clear: The $78K mark now represents vital support for $ BTC / USD.
The exponential moving average (EMA) situated around $83K serves as resistance while analysts like Jelle have identified “$78K as our primary area of interest,” emphasizing:
“If we can establish it as solid support again,
we may be able make another attempt toward those moving averages.”
An accompanying analyst named Tradermayne mentioned that maintaining support within the range of$78k-$80k across lower time frames would provide “bulls with favorable bias levels.”
Analyst Master Of Crypto observed liquidity clusters forming around both sides of current spot prices and suggested these could soon be tested.
He commented:”Currently,$ BTC hovers near$78 .5 K–79 .1 K’s supportive zone.
If buyers manage defend this area successfully,the next upward movement might head towards$82 K–83 K where substantial liquidity resides.
Conversely,a break below here could send us swiftly downwards towards$75 k-$76 k.”
A heatmap indicating liquidation points reveals that falling beneath$78 ,000 would activate approximately & dollar ;3 .1 billion worth leveraged long liquidations across various exchanges.
This article adheres strictly Cointelegraph’s Editorial Policy and serves solely informational purposes without constituting investment advice or recommendations.All investments entail risks; readers should conduct independent research before making any financial decisions.
FAQ Section:
-
What does it mean when Bitcoin’s RSI is overbought?
When Bitcoin’s Relative Strength Index (RSI) reaches above 70 it’s considered “overbought,” indicating potential price corrections may follow. -
If Bitcoin breaks below which level might we see further declines?
A break below $78k may trigger further declines potentially leading down towards ranges between & dollar ;75 k-$76 k. -
This recent surge was how much percentage-wise?
Bitcoin saw approximately 36% growth reaching up-to & dollar ;82 ,800 after previously hitting macro lows around & dollar ;60 ,000.