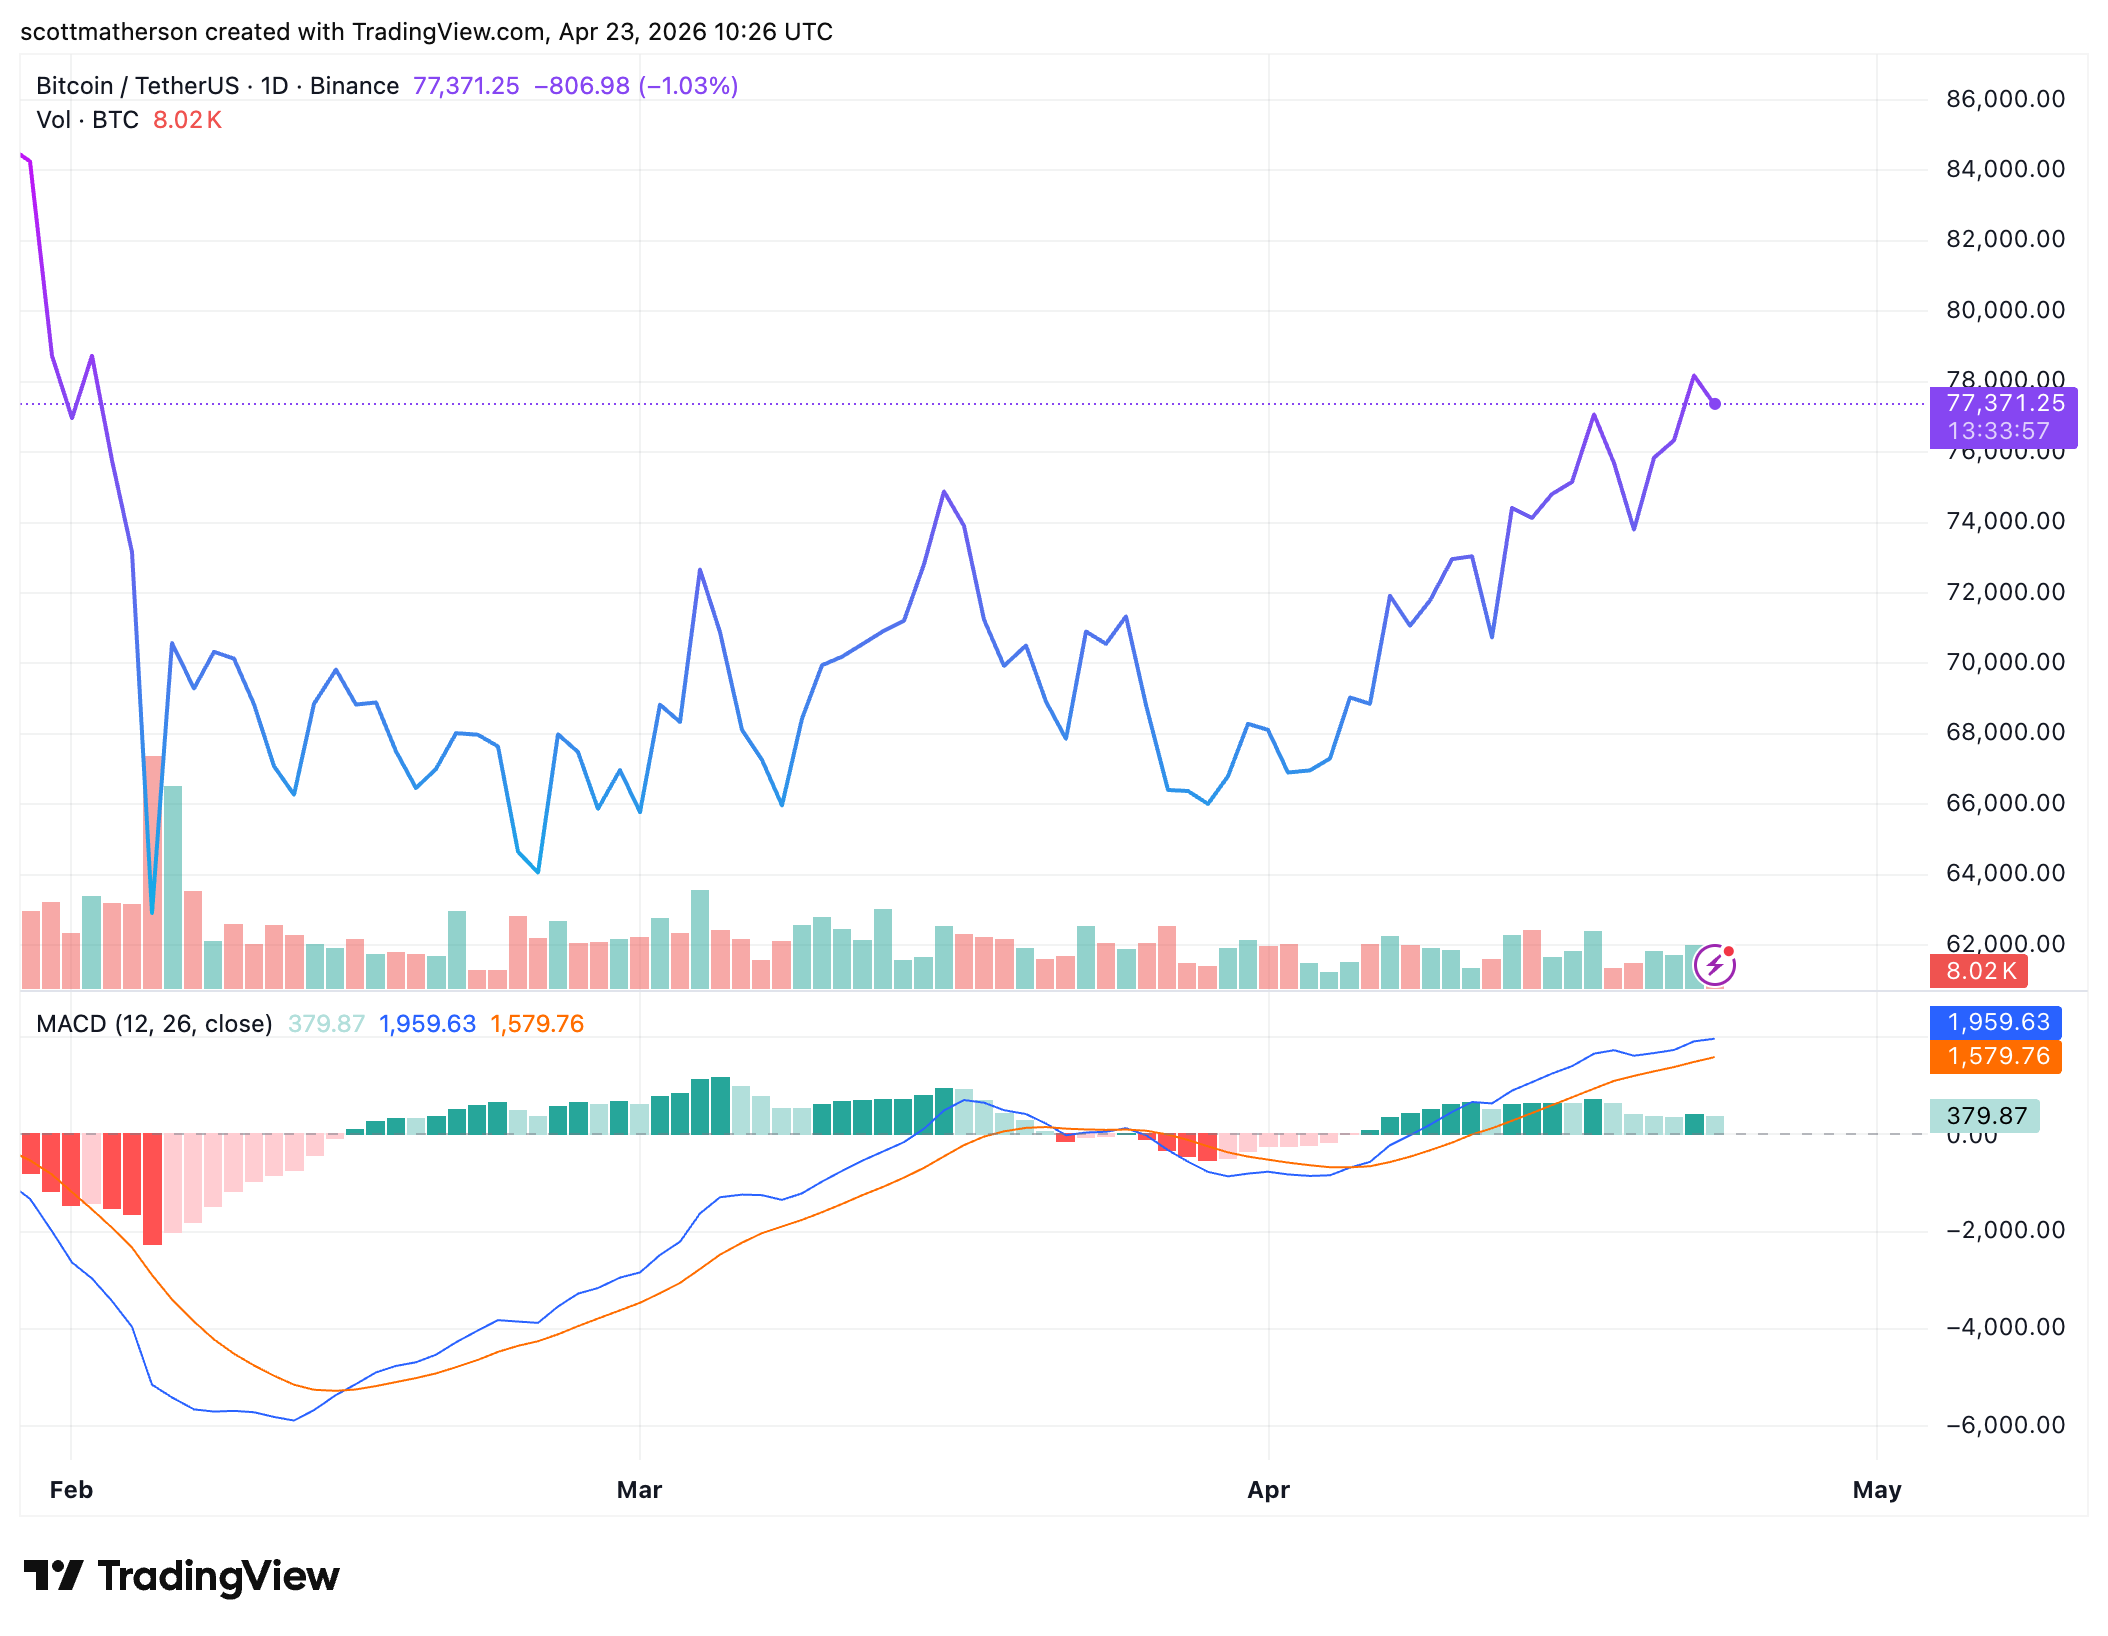
Bitcoin’s recent price movement has entered a territory that one analyst suggests was never intended to sustain. Over the weekend, the cryptocurrency surged to $78,000 and even exceeded $79,380 within the last 24 hours.
Technical analysis indicates that this surge has created an unresolved discrepancy—an imbalance in pricing that markets typically tend to revisit.
The Weekend Surge Left Unsettled Issues
Crypto analyst Minga shared insights on X regarding a trend observed in Bitcoin’s 4-hour candlestick chart. The analyst believes that $BTC is currently addressing the imbalance generated over the weekend. Minga’s chart reveals a head-and-shoulders pattern forming, which is widely recognized as a strong bearish reversal indicator in technical analysis.
The left shoulder and head of this pattern have already materialized, with Bitcoin now working on completing its right shoulder. The analyst pinpointed a rejection zone between $76,800 and $77,400—highlighted in red on the accompanying chart—as likely being where this right shoulder will peak.
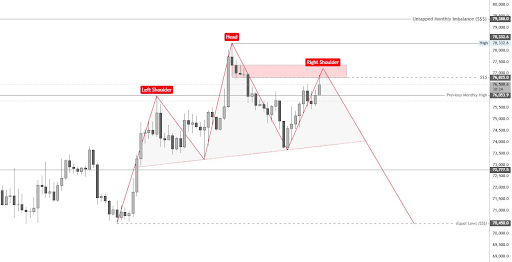
If this formation comes to fruition, it would indicate a shift from upward momentum into distribution mode—where larger market players begin selling off their positions. The neckline of this formation is situated around the mid-$73,000 range and aligns with an ascending trendline that has provided support recently.
The Future Path for Bitcoin
This technical assessment suggests that Bitcoin’s current upward movement may merely be retesting previous levels; once the right shoulder completes its formation, it could lead to a downward breakdown. A critical level to monitor during any decline is last month’s high at approximately $76,053.
Minga emphasizes that if there’s rejection within the red box ranging from $76,800 to $77,400 followed by breaking below last month’s high during subsequent tests of these levels could confirm bearish expectations. Should this scenario unfold as anticipated by Minga’s analysis two significant downside targets emerge: first being an equal low around $70,450 marked as liquidity target on prior charts.
A failure to dip below last month’s high at $76,053 would negate any bearish outlooks and potentially trigger another rally towards higher peaks aimed at surpassing Monthly FVG above $79K mark.
The second notable reference point lies within an untouched monthly imbalance set at approximately $79K; should Bitcoin break past resistance at about 78K while establishing acceptance above such thresholds then targeting monthly fair value gaps becomes plausible upside objective moving forward .
As of now ,Bitcoin trades around$77 ,640 just slightly above identified rejection zones ranging between$76 ,800 -$77 ,400 .
Featured image sourced from Pixabay; charts credited towards Tradingview.com