
Currently, Bitcoin is trading at approximately $66,400, which represents nearly a 48% decline from its peak of $126,080 reached in October 2025. A technical analysis indicates a critical juncture for potential correction.
A crypto analyst known as Leshka.eth suggests that Bitcoin is nearing a pivotal price point that will dictate whether this market cycle continues or undergoes a significant reset. This crucial threshold is set at $60,000; its stability could influence Bitcoin’s price movements for the remainder of the year.
$60,000: The Crucial Defensive Line
Leshka.eth emphasizes that the $60,000 mark has become an essential zone within the current market dynamics for Bitcoin. He refers to this level as the final line of defense against deeper corrections leading to lower prices.
Recently, Bitcoin has been hovering around the low $70,000 range and experienced another drop of 3.3% over the past day. While it remains above $60,000 for now, this buffer is becoming increasingly precarious given emerging downside risks.
The weekly candlestick chart shared by Leshka.eth illustrates how previous breakdowns from similar patterns have resulted in significant price declines. However, it’s noteworthy that during this cycle so far; Bitcoin has not breached the critical $60,000 level—after crashing earlier in February and finding support around $63,000.
This context underscores why maintaining above the $60K threshold is vital—it has served as a robust support level over recent months and helped sustain higher pricing between ranges of $63K and $76K. Thus losing ground below this mark would indicate buyers have relinquished control over an important structural support level throughout this cycle.
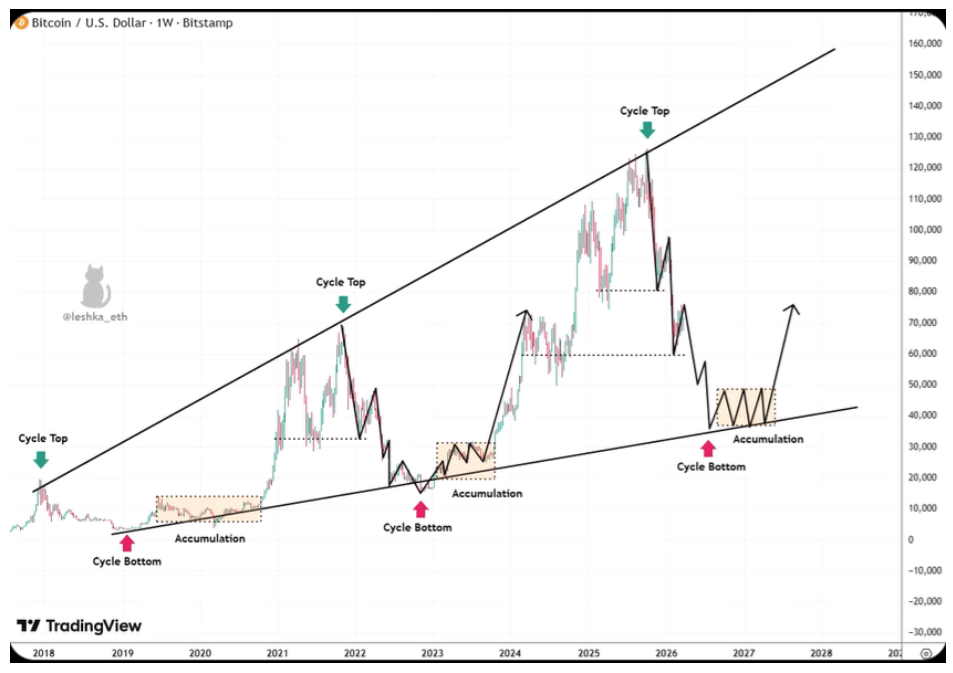
Bitcoin Price Chart Source: @leshka_eth On X
The Macro Trendline Across All Bitcoin Cycles
A broader perspective emerges when examining long-term trendlines across various cycles of Bitcoin’s history. This trendline spans from 2018 to projections extending into 2028 on weekly candlestick charts and connects significant lows formed during extended bearish phases.
In late 2018 after reaching its peak value; Bitcoin plummeted down to meet this trendline again in early 2020 before entering an extensive accumulation phase near those lows—ultimately culminating in a surge towards new heights during its top cycle in 2021. The same pattern was evident during last year’s bear market when it crashed from record highs only to return once more toward macro trends by early-2023 before beginning accumulation again leading up towards hitting highs near $126K by October of 2025!
This crucial trendline now hovers around the $40k range according to analysts’ observations if BTC manages holding onto levels above sixty thousand dollars then we can expect continued growth otherwise breaking through could mean revisiting forty thousand dollars where accumulation might start anew wrote Leshka.eth on social media platform X!
Featured image sourced from Pexels; chart data obtained via TradingView