Today, the cryptocurrency landscape resembles a precarious balancing act as Bitcoin hovers just above a vital support level, attracting both skeptics and optimistic traders. With the market caught in a dilemma of whether to rebound or plunge further, let’s explore the technical aspects where all the action unfolds and signals are fluctuating.
Bitcoin Price Analysis
The daily chart reveals that Bitcoin has donned its bearish attire and is making its way through the charts with determination. After an unsuccessful attempt to breach $97,939, Bitcoin experienced a swift decline marked by numerous red candles and panic selling.
The current trading range around $88,000 coincides with an essential support level; however, without a robust bounce or significant volume reversal, the outlook remains predominantly bearish. The surge in selling volume suggests institutional offloading rather than retail interest. In essence: this isn’t merely a friendly dip—it’s indicative of deeper structural issues.
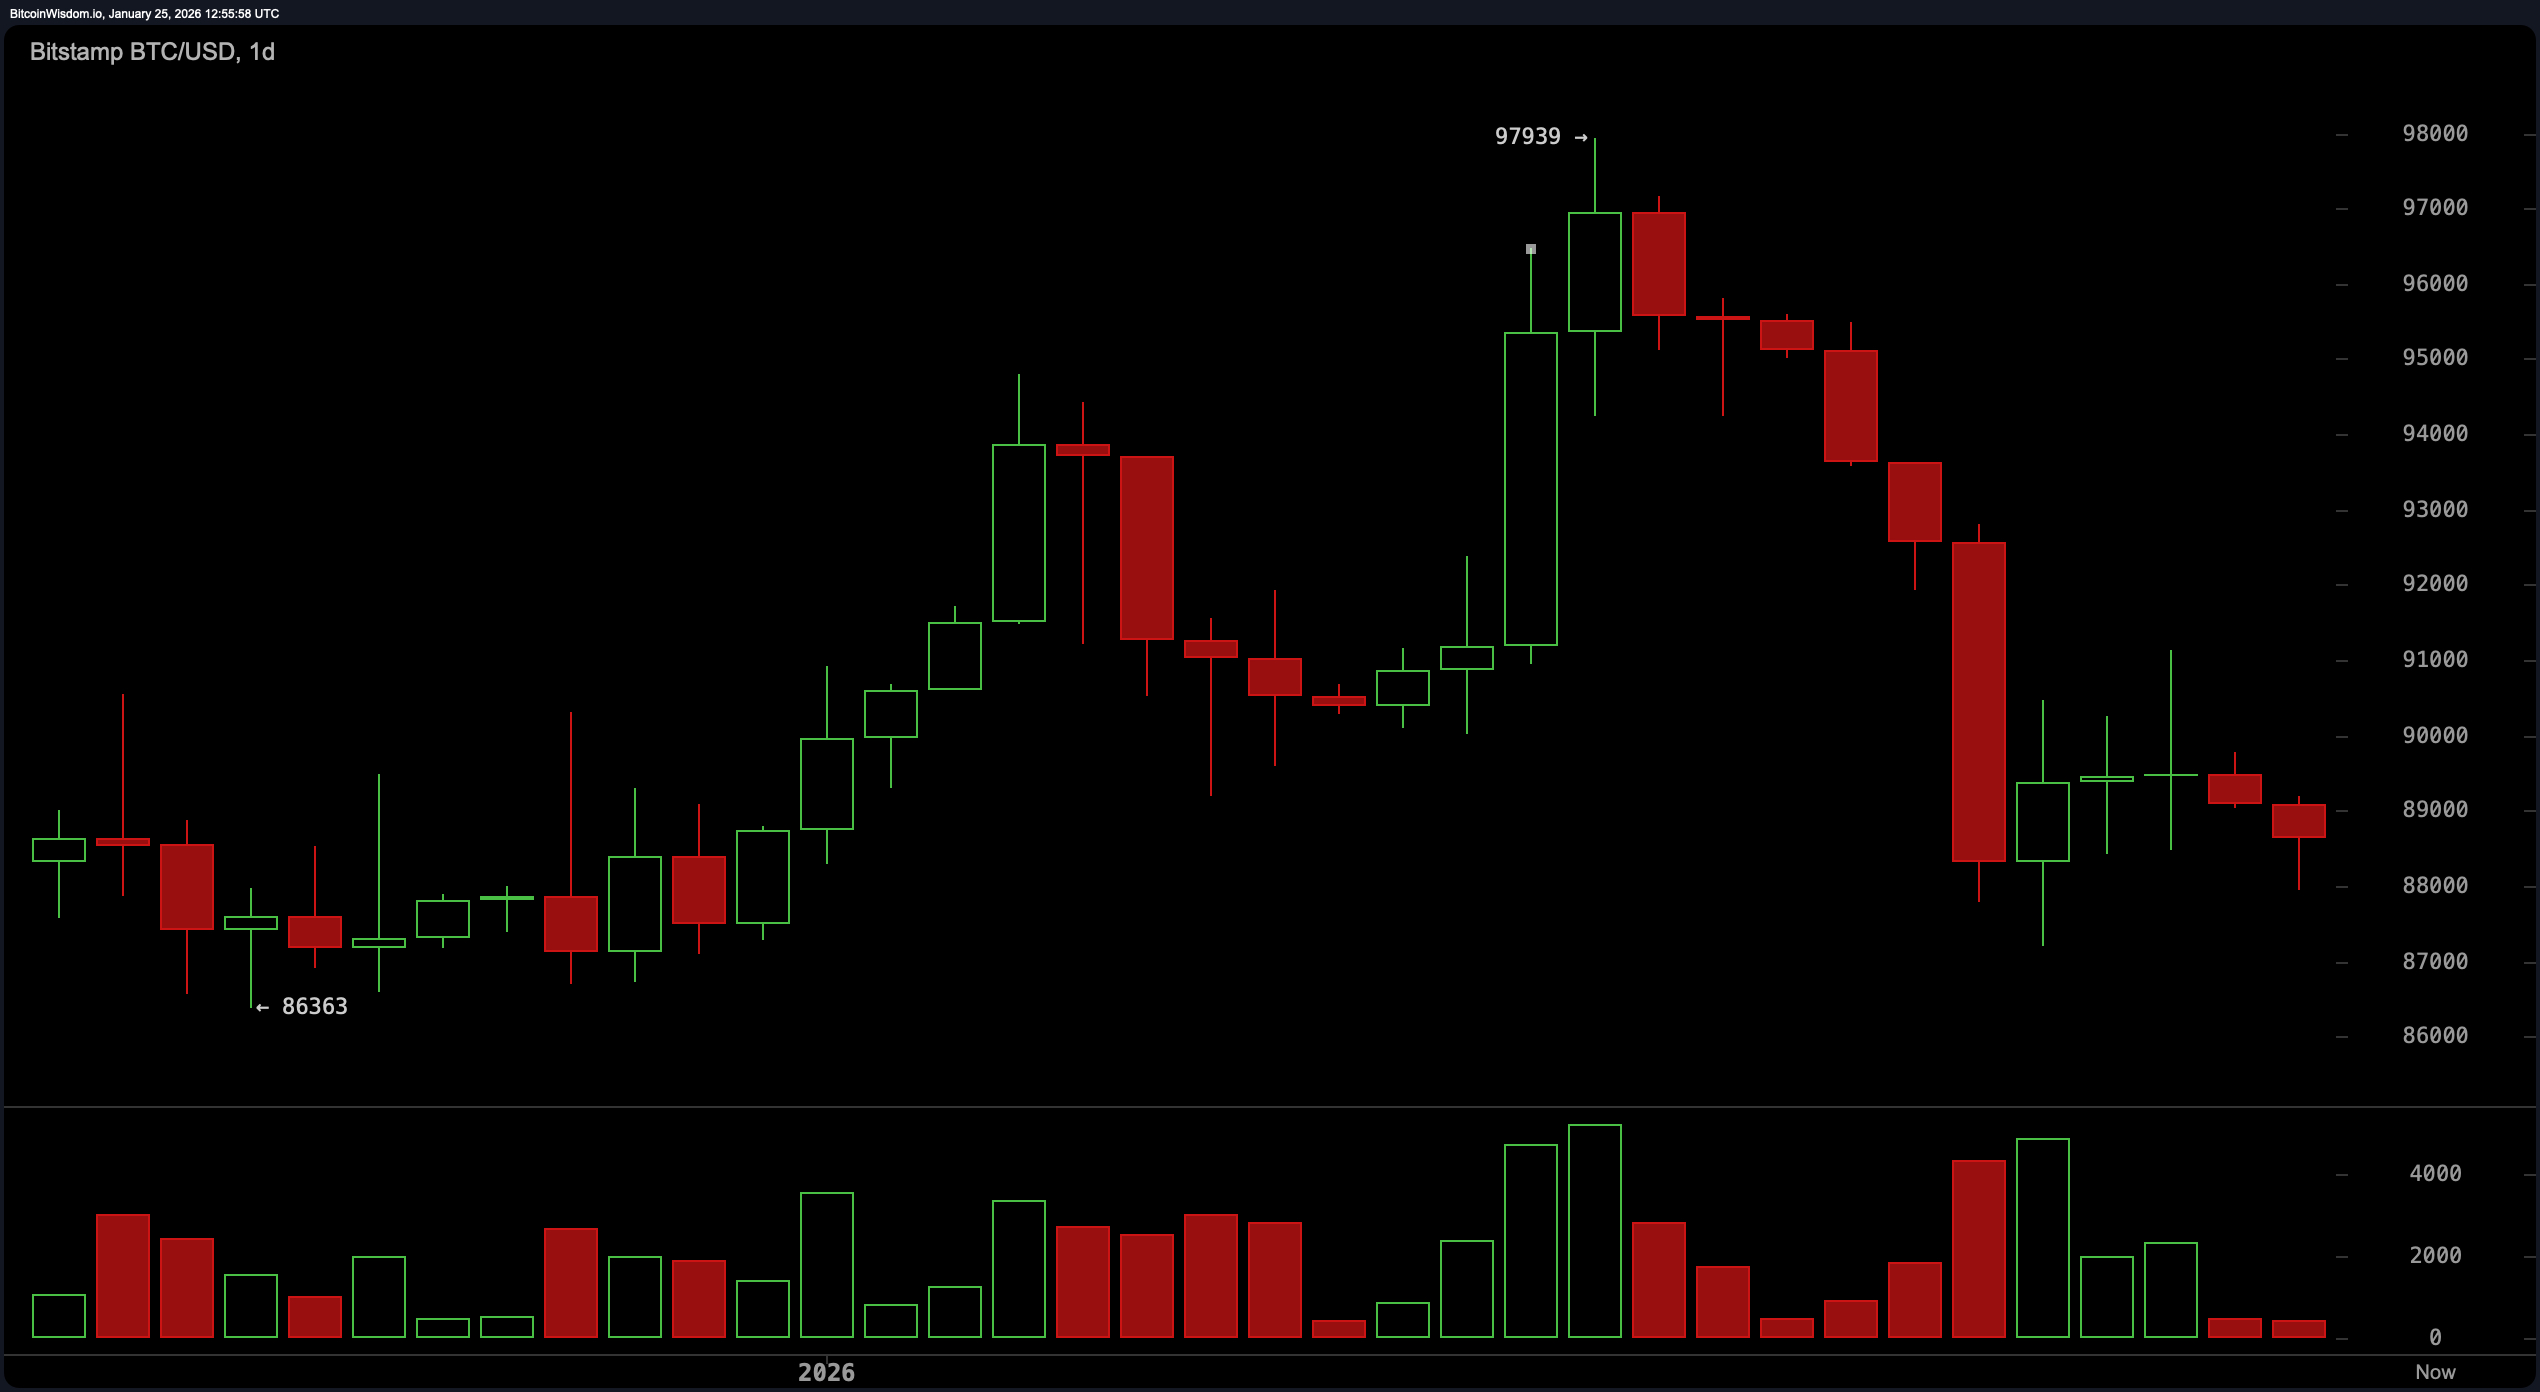
BTC/USD 1-day chart via Bitstamp on Jan. 25, 2026.
Examining the 4-hour chart reveals price movements trapped in an unenthusiastic sideways pattern between $87,193 and $89,500. This trend appears as a short-term downtrend masquerading as consolidation—a potential bearish flag unfurling slowly. The market’s inde