Bitcoin is currently under selling pressure and must maintain crucial support levels to avoid further declines, according to market analysts who emphasize the importance of momentum shifts.
At present, Bitcoin (BTC) is trading near $86,729 after slipping 0.8% within the last day. Over the past week, it has fallen slightly by 0.3%, while a more pronounced decrease of 6.4% has been recorded over two weeks.
This downward trend mirrors broader market uncertainties and upcoming events such as U.S. initial jobless claims data releases and Christmas holiday closures that could reduce liquidity and increase price volatility. Should Bitcoin fail to hold its current support zones during this period of thin liquidity, additional price drops may be imminent.
Could Bitcoin Experience Further Declines?
Technical analysis reveals that Bitcoin is testing a vital support level indicated by Fibonacci retracement tools. The cryptocurrency’s price remains just above the 0.236 Fibonacci retracement mark at approximately $86,835, which currently acts as a key floor for prices.
If this level breaks downwards decisively, we might see BTC fall toward its next major support near $84,440—corresponding with the zero point on the Fibonacci scale.
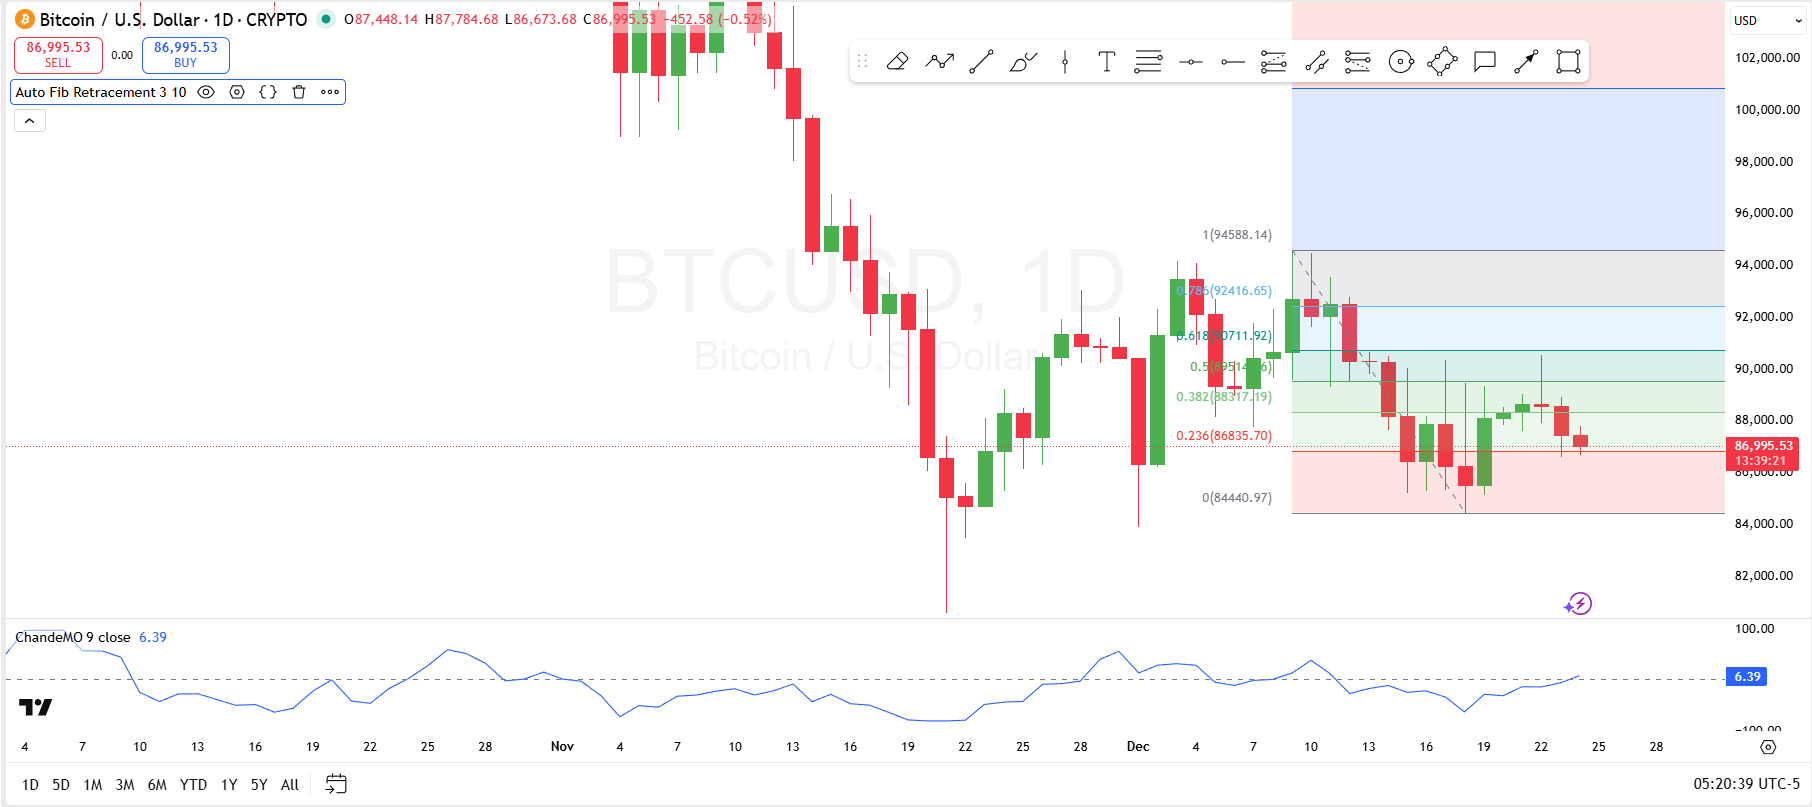
The immediate resistance lies around the 0.382 Fibonacci level at roughly $88,317; surpassing this could propel prices toward higher targets like $89,415 (the 0.5 level) or even up to about $90,711 at the 0.618 retracement mark—outlining clear scenarios for both upward and downward movements in BTC’s short-term trajectory.
The Chande Momentum Oscillator (ChandeMO), currently reading around 6.39 points suggests neutral-to-mildly bullish momentum in Bitcoin’s short-term outlook after recovering from deeply negative values near -65 earlier recently.
If BTC can sustain these supports while overcoming immediate resistance hurdles successfully, a short-lived rebound may occur; failure to do so might lead to continued declines below critical Fibonacci supports.
The Ultimate Challenge: Breaking Above $98, 500
A prominent crypto analyst known as Titan of Crypto on platform X highlights that Bitcoin remains confined between two significant liquidity zones spanning roughly from $80, 701 up to about $94, 595.
For momentum reversal favoring bulls hereon out: reclaiming key technical indicators such as crossing back above the Kijun line (depicted in blue), breaking through ongoing downtrend lines & moving beyond Kumo cloud boundaries are essential steps according to his analysis.

Titan stresses that real confirmation will come only if BTC manages an ascent past approximately $98, 500—a move requiring nearly a +13.6% rally from today’s trading range close around $86, 729.