According to cryptocurrency analyst Crypto Patel, Bitcoin’s long-term trend is currently in a noteworthy condition. He believes that the digital currency has officially transitioned into bearish territory after it fell below a significant support level of $107,000.
An analysis of Bitcoin’s weekly candlestick chart indicates that the cryptocurrency is now entrenched in this bearish phase, with predictions suggesting it could drop as low as $35,000 by 2026. This forecast relies on Fibonacci retracement levels which may guide Bitcoin’s future price movements.
Bearish Phase Initiated After Breaching $107,000
This technical assessment posits that Bitcoin entered its bearish phase following a breakdown beneath an important ascending trendline at approximately $107,000. This trendline—visible on the weekly chart shared by Crypto Patel—served as dynamic support during much of the rally from 2023 to 2025. It connected several higher lows and helped maintain the overall bullish structure until Bitcoin peaked at a price of $126,080.
The chart highlights the breakdown area with a red circle indicating where prices decisively lost their upward momentum. Following this breach, Bitcoin experienced altered momentum and began forming lower highs. According to Patel, losing this trendline marked the official entry into bearish territory for Bitcoin; thus necessitating a healthy correction before any potential recovery.
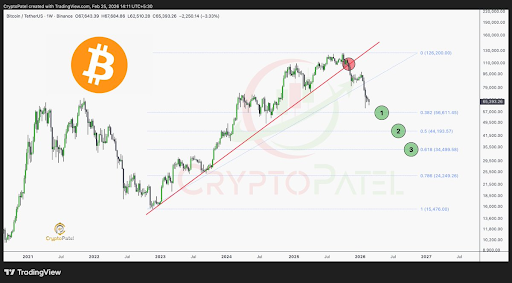
Fibonacci Levels Indicate Targets of $44,000 and $35,000
Since early this year, Bitcoin has been on a downward trajectory with expectations that it will continue until reaching around $35,000—a projection informed by past cycles’ corrections in its price history.
For example, during the bear market of 2018 there was an approximate decline of 84% from peak to trough; similarly in 2022 there was about a 77% reduction from its cycle high. In both cases these substantial pullbacks occurred prior to subsequent major rallies.
This historical context suggests that dropping below $50,000 from current levels would not be unusual but rather consistent with established patterns seen throughout previous cycles for Bitcoin.
The anticipated downside targets are derived from Fibonacci retracement levels based on October’s all-time high in 2025. Two key levels emerge clearly: firstly is the 0.5 Fibonacci retracement level around $44,000 which typically attracts strong buying interest during corrections—making it potentially pivotal if selling pressure eases off.
If support cannot be found near this level at $44K then attention shifts towards another critical point—the 0.618 Fibonacci retracement situated around$35K . The prevailing expectation remains that regardless if it holds above or dips below$44K eventually we can anticipate hitting bottom near$35K . As per recent data ,Bitcoin trades at$63 ,740 reflectinga decreaseof6 %within last24 hours .
Featured image sourced from Pngtree; chart provided by Tradingview.com