Bitcoin is currently stabilizing just beneath a significant resistance zone following a robust rebound from its December lows. The price action reveals a pattern of progressively higher lows, while blockchain data shows that the proportion of supply in profit has experienced a substantial reset and is now on an upward trajectory.
From a technical standpoint, the market stands at a crucial crossroads: either it breaks decisively above the existing resistance to initiate another upward surge, or it faces rejection that could lead to a corrective pullback toward recently established support levels.
Bitcoin Price Overview: Daily Chart Insights
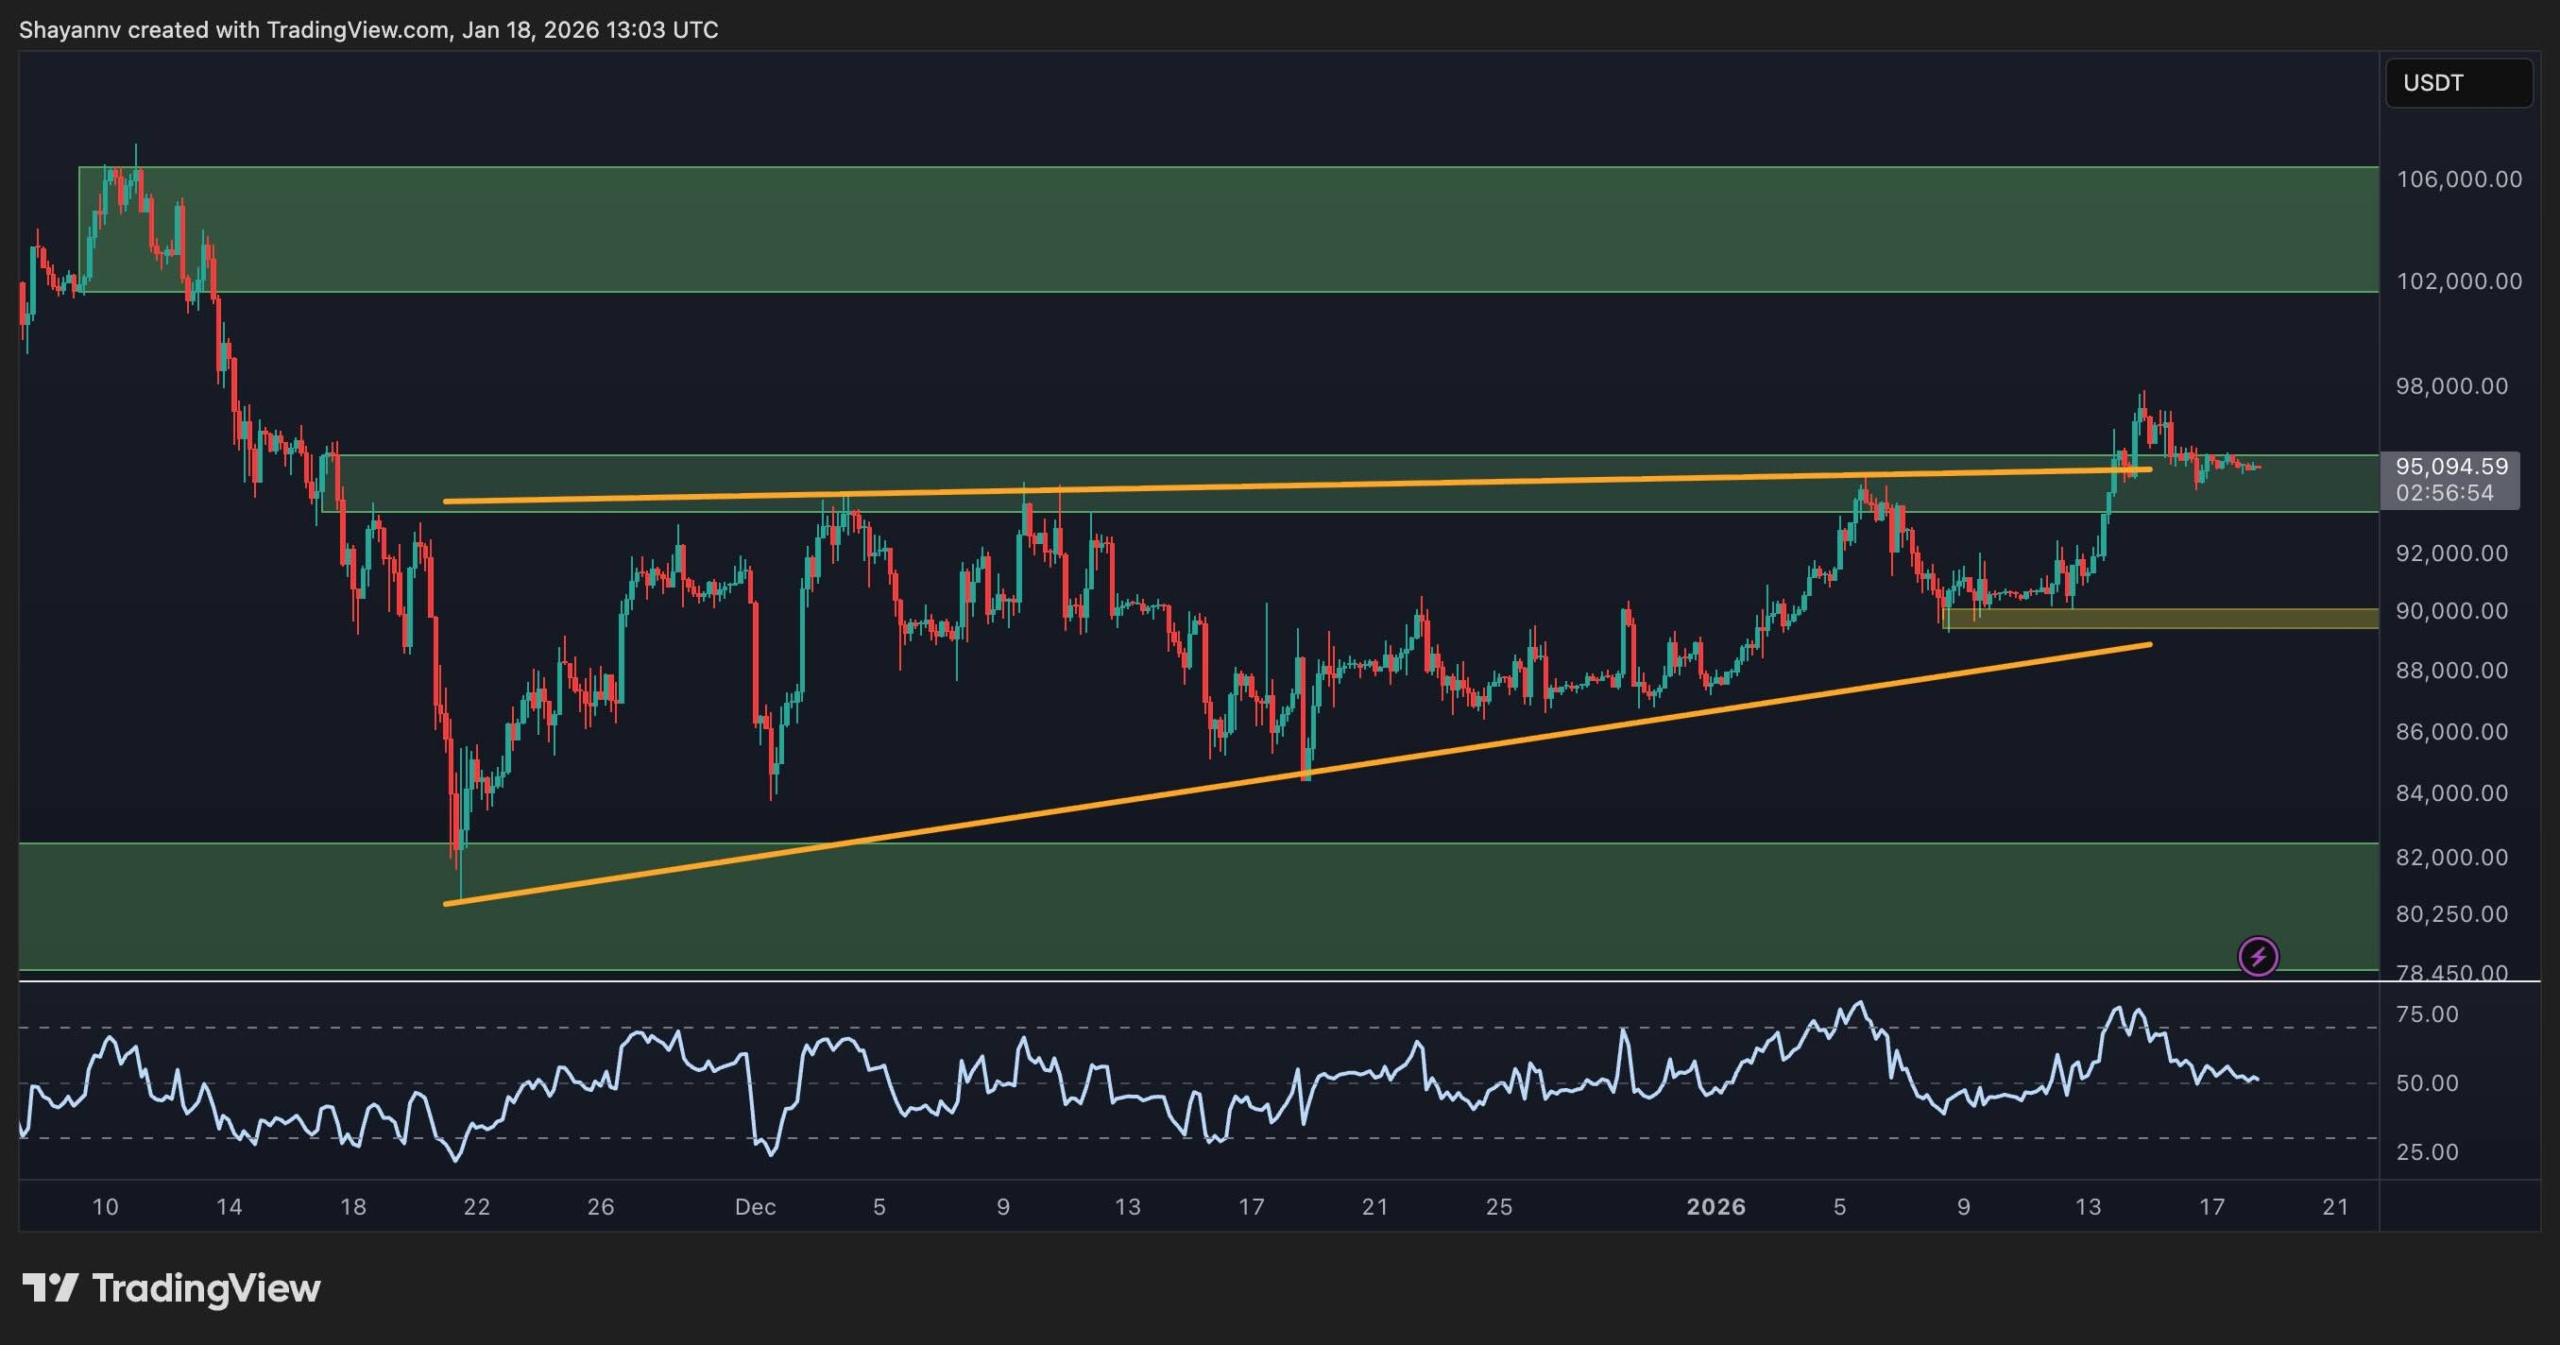
Examining the daily chart, Bitcoin (BTC) hovers near the $95,000 resistance range. This level aligns with both the lower edge of an extensive supply zone and the 100-day moving average. Since November, this area has consistently capped price advances and now represents a pivotal test point for bulls and bears alike.
Beneath this threshold lies an ascending trend originating from around $80,000 demand territory. This structure features successive higher lows supporting recent gains that propelled BTC into current resistance without significant daily retracements. Should rejection occur here, immediate support can be found near $90,000 — marking an important short-term floor.
The daily Relative Strength Index (RSI) has eased off previous overbought conditions but remains above its midpoint line. This suggests that Bitcoin remains in an early-to-mid phase of its trend rather than approaching exhaustion or peak momentum. Provided this rising low framework since December holds firm, overall sentiment on daily timeframes stays positive despite potential volatility around key resistance points.

BTC/USDT 4-Hour Chart Analysis
The four-hour chart reveals Bitcoin’s recent breakout from an ascending triangle formation after weeks of consolidation between flat resistance near $95,000 and rising trendline support within this pattern. The price has slightly surpassed this ceiling and is now consolidating just above previous highs—potentially eyeing moves toward $100,000 next.
However, momentum indicators like the 4-hour RSI show weakening strength in shorter time frames which raises caution about possible corrective dips or sideways trading phases ahead.
If such corrections materialize, $93,000–$94,000 serves as critical retest territory where maintaining stability would confirm bullish breakout validity. Further down, $90K marks prior consolidation zones acting as logical supports for deeper yet healthy pullbacks within ongoing uptrends.
Blockchain Data Insights
The Supply in Profit percentage metric offers valuable cyclical insights at present. Recently, a notable drop occurred where circulating BTC coins holding unrealized profits fell to levels reminiscent of those when prices were below $30K earlier in past cycles—even though current prices hover well above $90K.
This pronounced reset implies many coins changed hands or saw their unrealized gains diminish during recent corrections despite high nominal valuations.
Historically, such resets often precede fresh medium-term rallies by cleansing weaker holders out &font-weight:bold;font-style:bold;color:#333333;”>establishing stronger ownership bases.
The metric is currently rebounding towards approximately 70-75%, indicating improving profitability but still far from euphoric extremes exceeding 95% typically seen at market peaks.
This scenario paints constructive on-chain fundamentals aligned with early rally stages—provided major technical resistances are eventually overcome.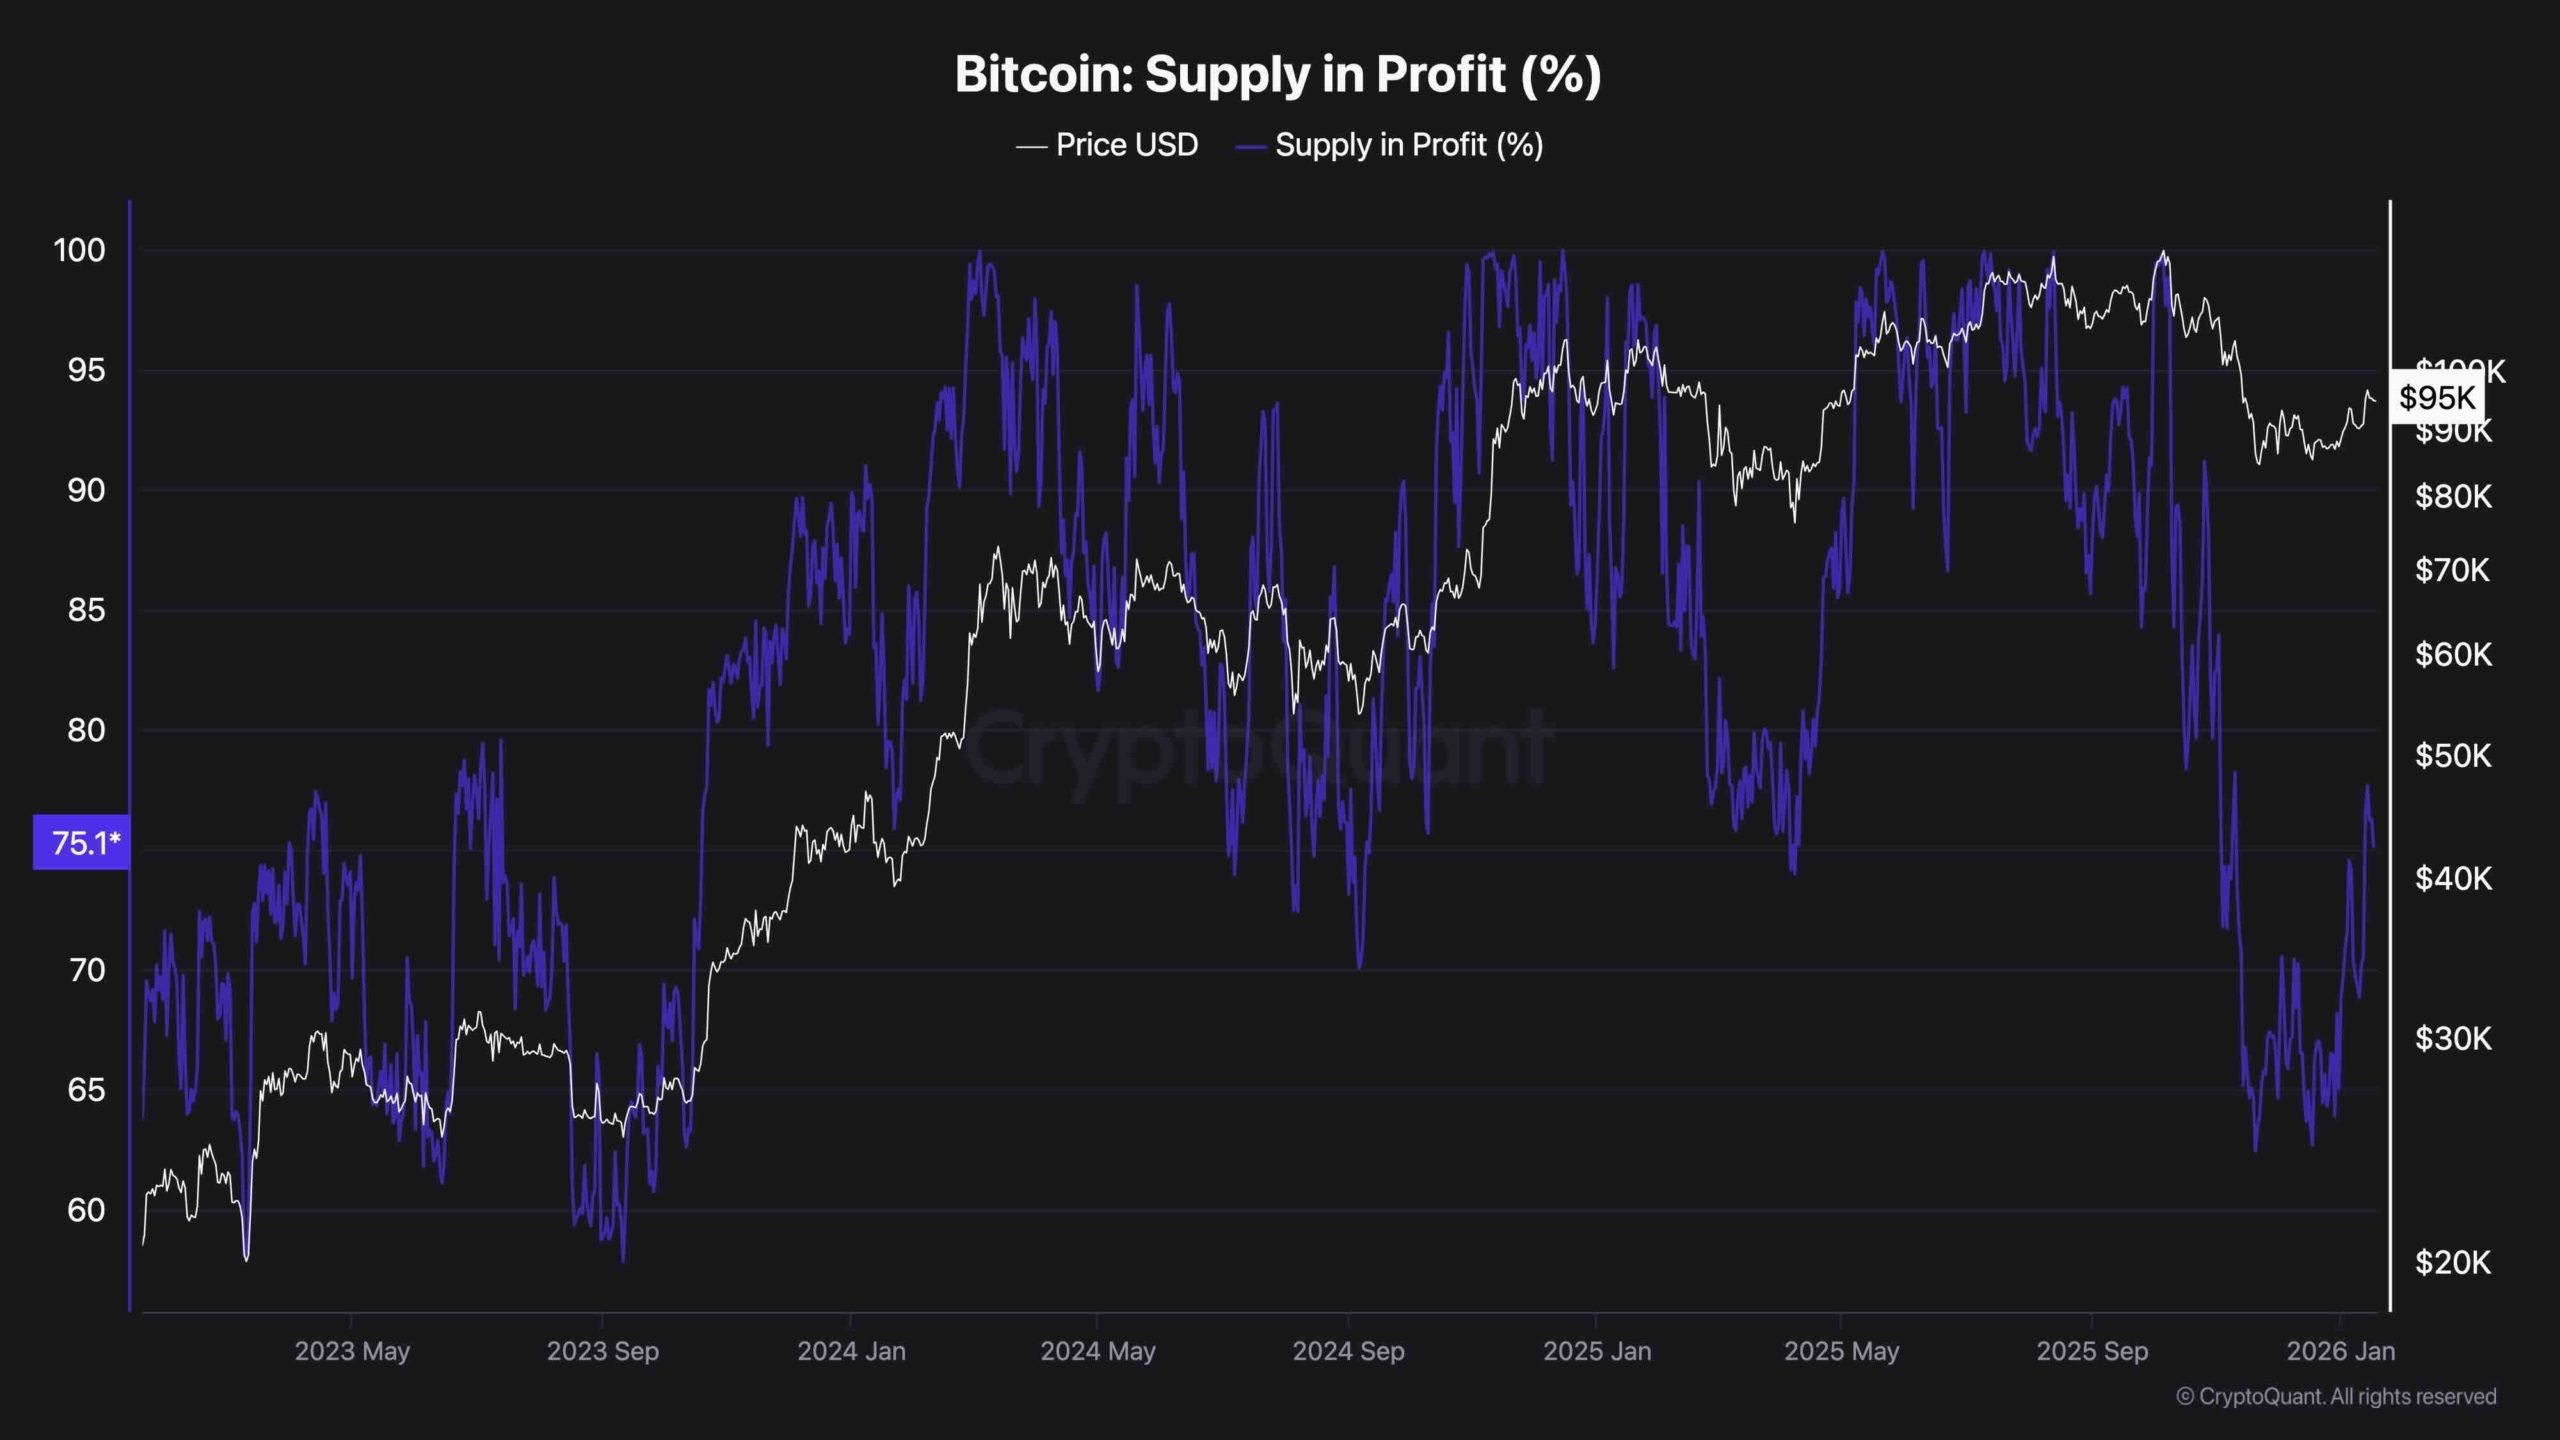 </html