In recent weeks, the cryptocurrency market has shown consistent upward movement. This progress is largely driven by institutional interest and inflows related to short-liquidation events, which have helped Bitcoin stabilize above the $90,000 threshold. Market experts emphasize that a pattern of rising lows combined with steady ETF inflows creates a cautiously optimistic outlook for Bitcoin’s near-term performance.
Bitcoin Approaches Crucial Resistance Level
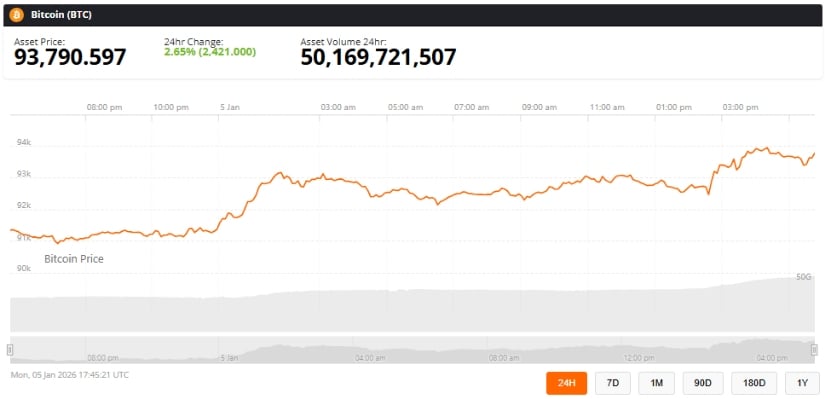
Currently trading around $93,790 with a 2.65% increase over the past day, Bitcoin is nearing an important resistance zone near $94,000. Analyst Ted (@TedPillows) pointed out that closing daily prices above this level could pave the way for an advance toward $100,000. However, he also warned that failure to break through might result in revisiting support levels close to $90,000.
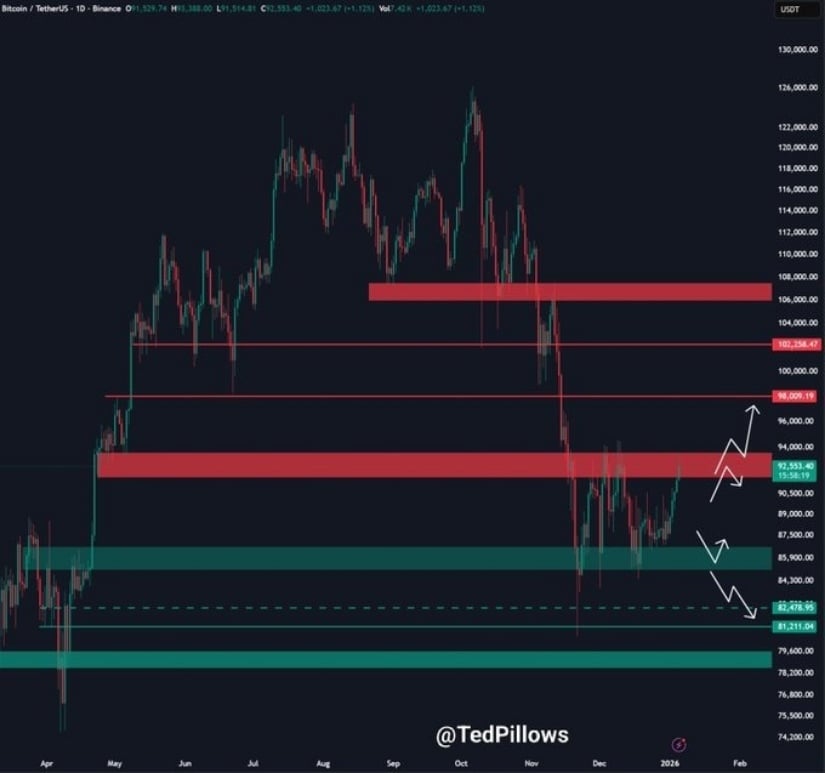
The chart illustrates how surpassing the $94K mark may trigger further gains toward six figures while rejection at this point could lead back down to test support at $90K (Source: @TedPillows via X).
Historically speaking, brief consolidation phases within this price range—especially following ETF-related capital injections or exchange-driven short squeezes—have sometimes sparked rallies lasting several weeks. Nonetheless, isolated short-covering episodes can cause temporary price surges that quickly dissipate. Traders should therefore differentiate between genuine structural demand and fleeting reflexive buying activity when analyzing market movements.
Binance Wallet Activity and Liquidation Patterns
Data from Arkham Intelligence reveals significant BTC transfers into Binance’s hot wallet recently—including transactions of 119 BTC (approximately $11.17 million) and 232 BTC (around $21.79 million). These large transfers are likely linked to liquidation processes rather than discretionary acquisitions by Binance itself.
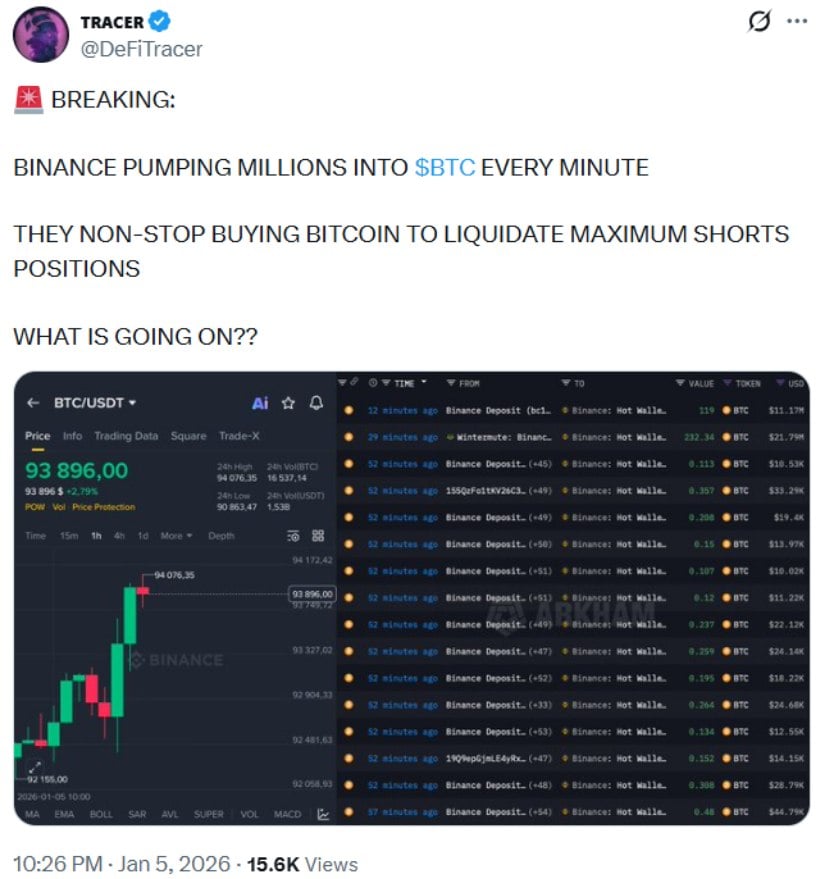
The influx of Bitcoin into Binance coincides with buying triggered by short-liquidations which fuels momentum in the market (Source: @DeFiTracer via X).
While such inflows can accelerate bullish momentum temporarily, past instances show they may also introduce volatility instead of sustained upward trends. Therefore observers should view these movements as factors influencing overall market dynamics rather than definitive bullish indicators.
Technical Indicators Point Toward Potential Gains
A TradingView analyst known as DeGRAM noted that BTC/USD recently broke above a descending resistance line after forming a symmetrical triangle pattern over an extended period. He stated that “the breakout confirms positive momentum supported by higher lows along an ascending support trendline.”
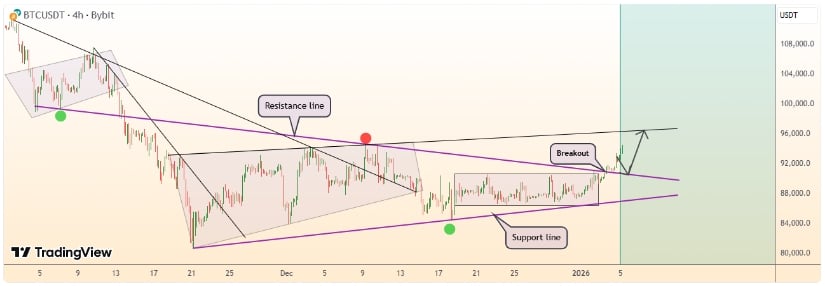
- Projected target range: $95,000–$98,000
- Main support zone: $90,000–$,000
Technical confirmation hinges on closing daily prices beyond $'',00 accompanied by robust volume levels.
Conversely, a substantial drop below $,00 on heavy volume would undermine current bullish expectations and potentially trigger deeper consolidation.
Final Thoughts
Bitcoin’s immediate future appears cautiously optimistic due to strong institutional backing from ETFs alongside technical signals indicating rising supports.&;nbsp;
Traders should watch closely for decisive daily closes exceeding $,00 paired with increased trading volumes while monitoring critical risk thresholds like supports near $,00-,00 plus resistances around $,00.
BTC was last seen trading approximately at 93,&sap=10&sap=20&sap=30&sap=40&sap=50″ width=”825″ height=”399″>
The impact of ETF contributions combined with distinguishing between fundamental versus reactive flows along with macroeconomic data such as U.S manufacturing reports will be crucial in interpreting upcoming price developments.
Although reaching $100k remains feasible under present conditions there exists potential setbacks if breakout attempts falter or broader economic pressures affect risk assets.
Continuous observation of transaction patterns together with price action will be vital for investors aiming to identify sustainable growth versus transient fluctuations during forthcoming weeks.