Bitcoin ($BTC) is currently experiencing a price recovery, trading above $77,400 as of Friday following a slight dip earlier this week. However, institutional interest appears to be cautious as the spot Exchange reports an outflow through Thursday amidst the Federal Reserve’s (Fed) hawkish stance and ongoing uncertainties regarding US-Iran peace negotiations, which may limit Bitcoin’s upward momentum. Nevertheless, optimism surrounding the largest cryptocurrency by market capitalization persists as it concludes its second consecutive month of positive returns.
Cautious Stance Among Institutional Investors
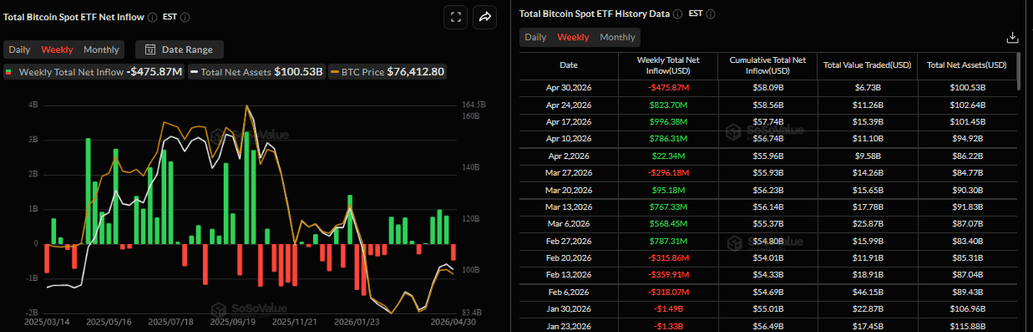
This week has seen a careful approach from institutional investors. Data from SoSoValue indicates that Bitcoin’s spot ETF recorded an outflow of $475.87 million through Thursday. Should this trend continue into Friday, it would disrupt four weeks of inflows that began in early April and could lead $BTC to extend its short-term correction.
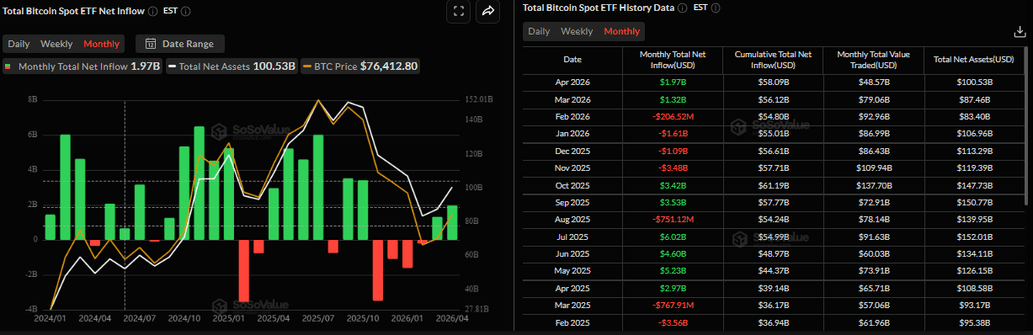
On a monthly basis, however, $BTC has achieved a total net inflow of $1.97 billion in April alone—marking two consecutive months with positive inflows. If this trend continues into May, we might witness further rallies for $BTC.
From a corporate perspective, demand for $ BTC remains strong . Michael Saylor announced on X on Monday that his company , Strategy (MSTR), had acquired another 3 ,273$ BTC for $255 million to bolster its reserves . The firm continues its aggressive accumulation strategy , bringing total holdings to 818 ,334$ BTC despite reporting an unrealized loss of $14 .46 billion on these holdings during Q1 amid ongoing tensions between the US and Iran.
The Impact of Macro Headwinds and Geopolitical Tensions on $ BTC
This past week saw Bitcoin extend its correction with prices dipping below $76 ,000 on Wednesday due to the Fed’s hawkish tone coupled with geopolitical tensions surrounding US-Iran relations favoring USD bulls while placing pressure on risk-sensitive assets like$ BTC
The Fed opted not to change interest rates at their April meeting held Wednesday within the range of 3 .50 % – 3 .75 % as anticipated by most participants in the markets ; notably three policymakers dissented against maintaining accommodative language within policy statements marking highest dissent levels since1992; another voted for rate cuts.
Dissatisfaction over these decisions was expressed during Jerome Powell’s post-meeting press conference where he clarified discussions centered around neutrality rather than immediate hikes being necessary; traders subsequently reduced bets concerning future easing until2026 pricing now suggests over10% chanceof rate increase by December accordingtoCMEFedWatchtool.
This decision coincideswithwar-driven energy price surges causing inflationary concerns amid stalled negotiations regarding peace talks betweenUSandIran; uncertainty stemmingfromsecondroundnegotiationsinMiddleEastconflicthasemergedasashort-termfactorlimitingupsidepotentialforrisk-assetswhilegeopoliticalriskscontinueweighingdownmarketsentimentacrossvarioussectors.
A mild boost was providedto crypto marketsby earnings reports releasedfromlargeUSTechcompaniesonThursdaywhichhelpedCryptoKingrecoverslightly.AsFridayapproaches,$B TC extendsitsreboundabove$77K.
<Whereis’targe t=_bl ank’>B TC headinginMay?
B itcoin concludedAprilpositivelyextendinggainsbyover11%buildinguponmildpositivereturnsachievedduringMarch.Additionallymonthlytrendsindicatecontinuedoptimism.HistoricallytheCryptoKinghasdeliveredaveragegainsof7%.66%duringMay.
Ifinstitutionalinflowspersistregulatorydevelopments(likeClarityAct)turnsupportiveforthebroadercryptoecosystemandMiddleEasternconflictresolvesinvestorconfidenceandriskappetitecouldbe restoredleadingto favorableconditionsfortherecoverythesisplayingout
T echnical outlook:B uls remainincontrol
Bitcoinsawpriceincreaseexceed6%lastweekclosingabovethe61.% Fibonacci retracement levelat78,$490(drawnfromAugust2024lowof49,$000toOctober2025all-timehighof126,$199).Atstartoftheweek,BTCencounteredminorrejectionnearthekey80,$000thresholdcurrentlytradingloweraround77,$400onFriday.
IfBitcoincontinuesitsupwardtrajectoryitcouldextendrallytowardpsychologicalbarrierat80Kfollowedby100-weekEMAaround82.$482.PTheRelativeStrengthIndex(RSI)ontheweeklychartreads46nearingneutral50levelindicatingweakeningbearishmomentumwhileMovingAverageConvergenceDivergence(MACD)indicatorshowedbullishcrossovermid-Aprilremainsintactwithrisingpositivehistogramsupportingbullishtendency
Source:
Onadailybasis,CryptoKingmaintainsabullishnear-termbiasaspriceshoverabove50-day&100-dayEMAsjustbelow75.$700withinformerchanneltopactingimmediatesupportaround75.$680.TheRSIonthedailynears58suggestsconstructivemomentumnotyetoverextendedwhereasnegativeMACDhistogrambelowzerolineimpliesupsideadvancementagainststillsoftbroadermomentumbackdrop.Oninitialdownside,supportisobservedattheformerchannelceilingnear75.$680&100-dayEMAat75.$675with38.%FibonacciretracementdrawnJanuaryhighFebruarylow74.,487&50-dayEMA73.,813reinforcingdeeperdemandsupportzone。
PThetopsidefirstnotableresistanceappearsat50%retracement78,.962aheadpsychologicalbarrier80K200dayEMAnear82,.27761.%retracement83,.437converginghorizontalcap84..410formingbroadersupplybandthatmaylimitnextleghigher。
(ThistechnicalanalysiswasconductedinpartnershipanAItool.)
FAQ
- What is driving recent changes in Bitcoin prices?: Recent fluctuations are influenced by institutional demand trends alongside macroeconomic factors such as Federal Reserve policies and geopolitical tensions affecting investor sentiment.
- How have institutional investments impacted Bitcoin?: While there were significant inflows earlier this year indicating strong interest among institutions towards cryptocurrencies like Bitcoin some recent data shows signs caution suggesting potential shifts ahead if outflows persist further impacting price movements negatively if they continue or intensify going forward;
- <strongWhat does technical analysis suggest about future trends?': Current indicators show bullish momentum despite slight rejections near key resistance levels suggesting potential upside movement if buying pressure resumes along with supportive regulatory developments restoring confidence among investors overall leading towards favorable conditions supporting recovery thesis playing out successfully!
`