On-chain analytics reveal that the Bitcoin Supply in Loss metric has recently shifted direction, a pattern historically linked to bearish market phases.
The 365-Day Moving Average of Bitcoin’s Supply in Loss Shows an Upward Trend
According to insights shared by a CryptoQuant analyst, the percentage of Bitcoin currently held at a net unrealized loss—the so-called Supply in Loss—has begun climbing again. This indicator calculates what portion of the total circulating $BTC supply is underwater based on transaction history.
The methodology involves examining each coin’s last transaction price and comparing it with today’s spot price. If the previous transaction price exceeds the current market value, that token is considered to be held at a loss.
By aggregating all such tokens, this metric determines their share relative to total supply. Its counterpart—the Supply in Profit—simply represents 100% minus this figure since both must sum up completely.
Below is a chart illustrating how the 365-day simple moving average (SMA) for Bitcoin’s Supply in Loss has evolved over time:
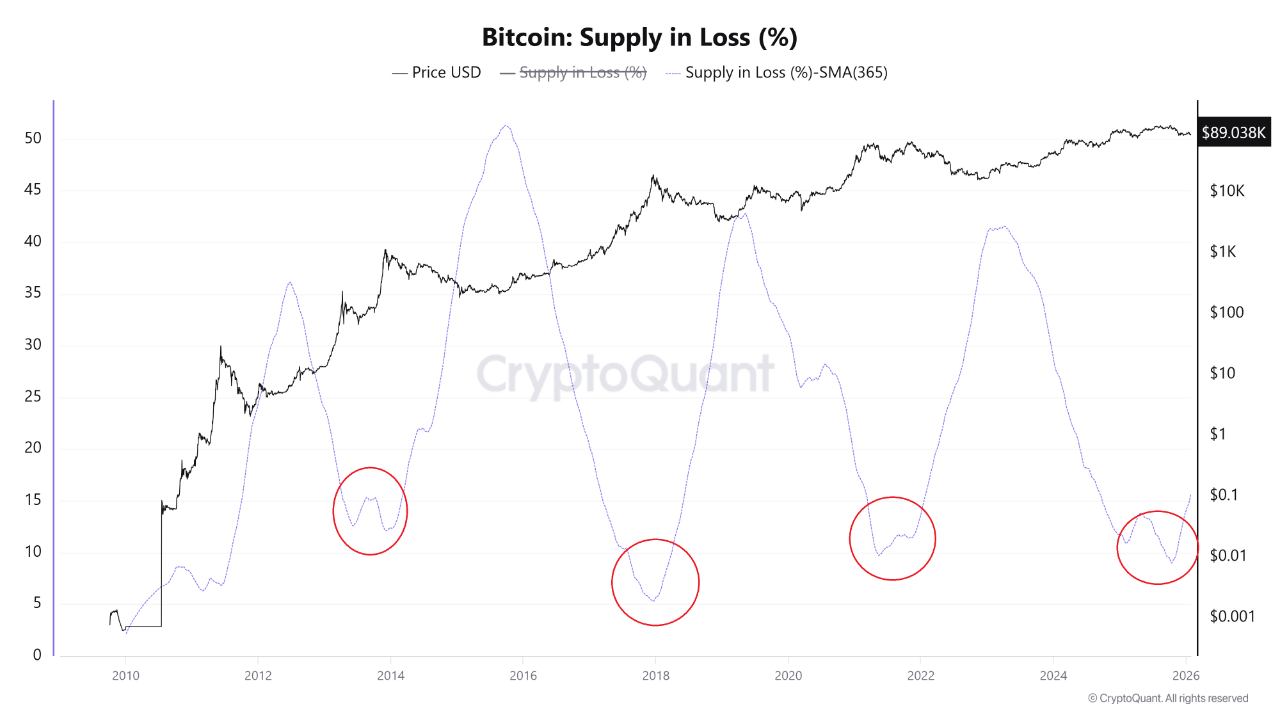
The graph shows that back in October, during Bitcoin’s surge past $126,000 reaching new all-time highs ($ATH) , this indicator dropped sharply to its lowest point within that cycle.
Since then, however, it has rebounded quickly as bearish pressures intensified following that peak. Although it hasn’t yet reached levels typical of major capitulation events seen previously, its upward momentum is becoming more pronounced.
A quantitative analyst explained: &ldquoHistorically speaking,&rdquo this reversal often signals early bear markets when losses begin extending beyond short-term holders and start impacting longer-term investors.”
The chart confirms past downtrends coincided with spikes in this metric—high values often aligned closely with cycle lows on previous occasions.
Whether this recent rise marks another similar downturn remains uncertain. Earlier fluctuations during this cycle saw temporary increases followed by renewed bullish trends rather than sustained declines leading into mid-2025.
$BTC Market Price Overview
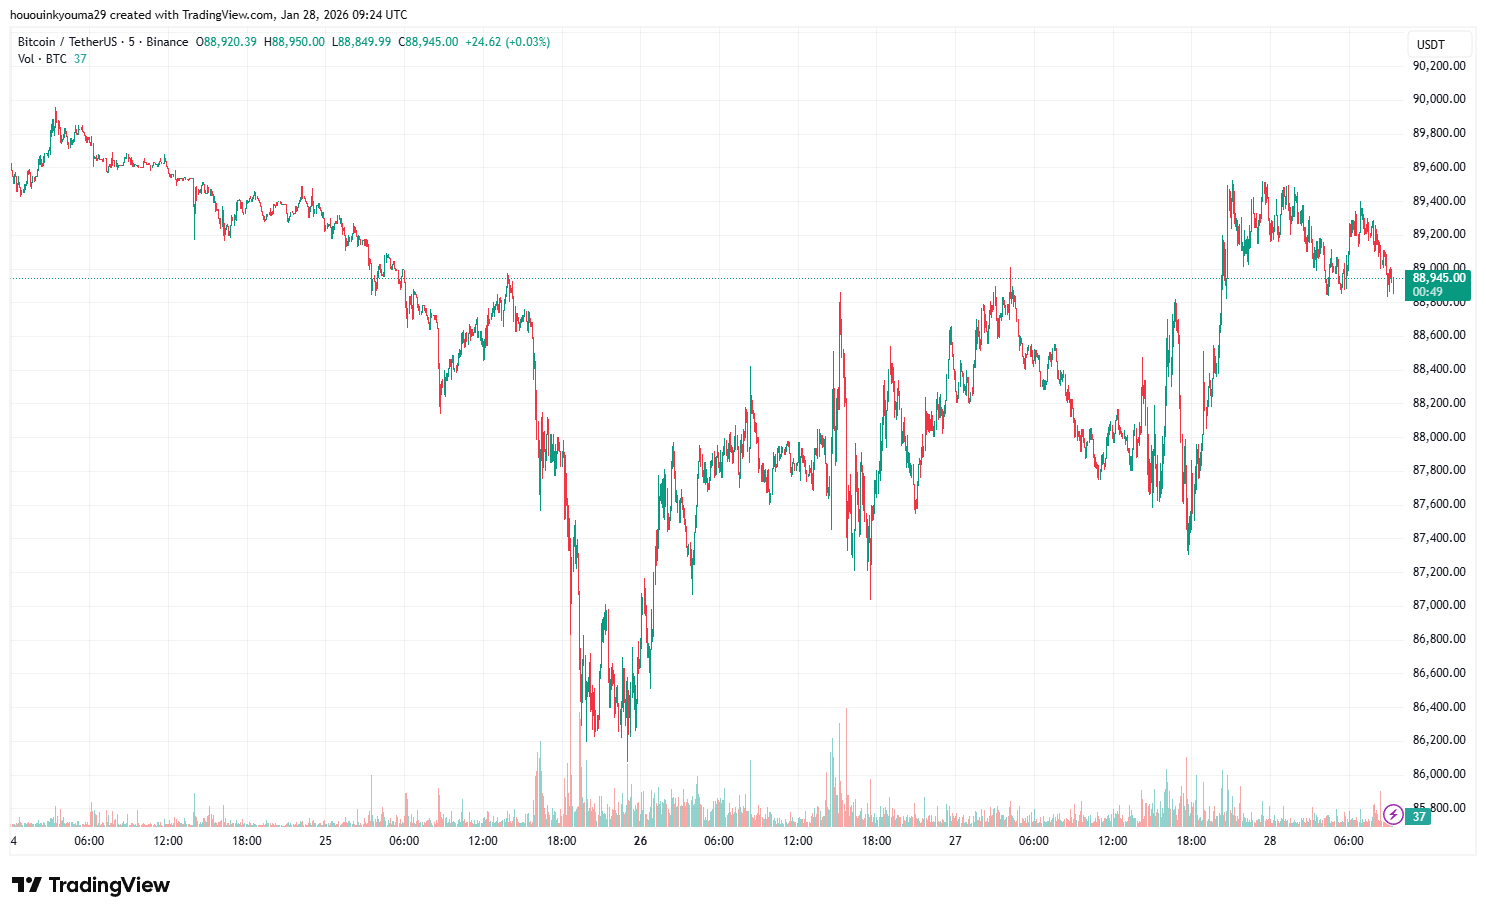
Currently trading near $89,000 at writing time—with gains exceeding one percent over the past day—Bitcoin continues showing resilience amid these mixed signals from on-chain data indicators.
Featured image created via Dall-E and charts sourced from TradingView.com