
Bitcoin is currently trading near the upper limit of its 24-hour range, yet the charts are not providing much reassurance. Priced at $77,989, Bitcoin appears to be in a constructive phase; however, short-term momentum indicators suggest it might need a boost.
Key Insights:
As of April 26, 2026, Bitcoin is maintaining its position at $77,989 and consolidating around the $78K mark with neutral signals.
According to TradingView data, the RSI stands at 64 and MACD at 2,047—indicating some momentum but lacking strong conviction.
The cryptocurrency is eyeing resistance levels around $79,500; a breakthrough or drop below $77,200 will determine its next directional move.
Bitcoin Chart Analysis
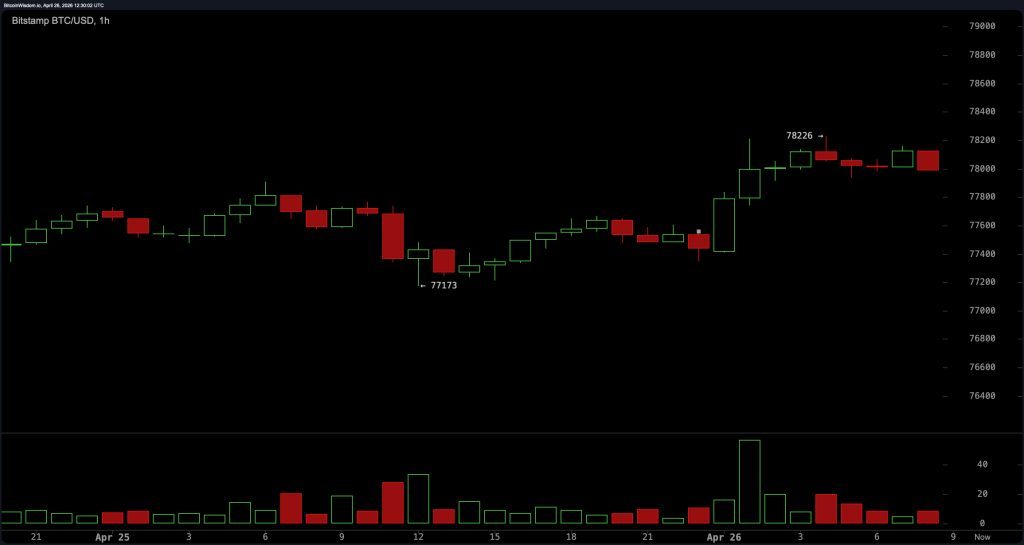
The one-hour Bitcoin chart reveals tight consolidation patterns with local resistance between $78,200 and $78,500 and support found between $77,200 and $77,400.
This hourly chart indicates that recent sharp upward movements have quickly stalled out. This suggests that buyers may be losing their short-term aggressiveness as they approach the top of this range. With prices still fluctuating within an intraday band from approximately $77.237 to $78.177 , patience seems more favorable than impulsive trading decisions right now.
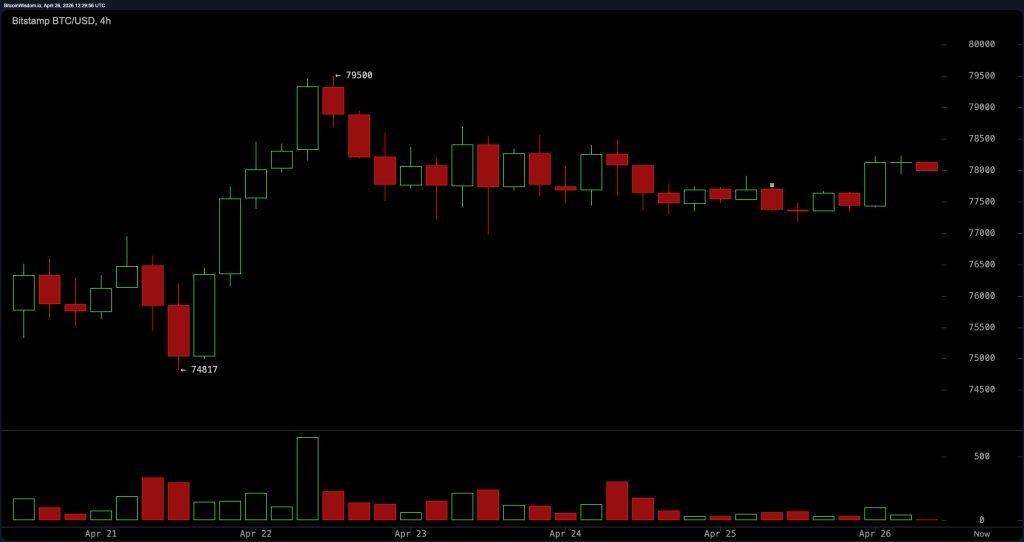
The four-hour Bitcoin chart continues to show price movement within established ranges after facing rejection near the significant level of$79 ,500 . The upper boundary lies between$79 ,000and$79 ,500 while support hovers around$77 ,000to$77 ,300 . Price action has been volatile with wicks on both sides indicating an environment ripe for liquidity sweeps—essentially suggesting mean-reversion behavior where directional conviction remains limited until there’s a clear breakout or breakdown scenario occurs .
The daily Bitcoin chart retains an overall bullish macro structure characterized by higher highs and higher lows ranging from roughly$65kto nearly$79k. However,the current consolidation near these highs comes alongside declining volume during this latest upward movement which suggests that momentum may be slowing down rather than accelerating further ahead.Resistance holds firm at around the levelof $.79500while layered supports exist closer towards $.75000and$.73500which helps maintain broader uptrend tendencies but also hints toward potential pauses or retracement phases in price activity going forward

The oscillator summary currently reflects neutral conditions consistent with ongoing consolidation trends observed across various timeframes.The relative strength index (RSI) sits comfortably positioned above sixty-four while stochastic readings indicate eighty percent thresholds alongside commodity channel index values hovering just above hundred along average directional indexes remaining stable close towards twenty-five.Awesome oscillators too display modest readings sitting just over five thousand seven hundred ninety reflecting neither extreme bullish nor bearish sentiments prevailing throughout markets presently affecting traders’ decisions accordingly.
Momentum measures clock in positively registering two thousand eight hundred twenty-seven whereas moving average convergence divergence (MACD) levels stand recorded just shy under two thousand fifty—both signaling potential positivity yet lacking decisiveness altogether.In essence,momentum exists but does not exhibit overwhelming forcefulness behind it thus far!
Moving averages summarize remain largely neutral despite supportive structures forming over shorter-to-midterm horizons.Exponential moving averages (EMA) ten read seventy-six thousand seven hundred twenty-five dollars whilst simple moving averages (SMA) ten reflect seventy-six-thousand-eight-hundred forty-six dollars respectively; EMA-twenty registers seventy-five-thousand fifty-eight dollars against SMA-twenty noting seventy-four-thousand nine-hundred thirty-seven dollar figures.Even longer term EMA-fifty clocks in about seventy-three-thousand-one-hundred sixty-three versus SMA-fifty showing similarly lower values nearer upwards toward respective targets seen earlier including those mentioned before!However EMA-two-hundred stands significantly higher marked upwards approaching eighty-two thousands four hundred sixty six dollars compared against similar SMA-values nearing eighty-four thousands nine hundreds seventies acting as substantial resistances curbing any enthusiasm seen recently amongst traders participating actively here today!
Bullish Perspective:
If Bitcoin can sustain support above the critical zone of $$77720 while regaining positive momentum through sustained moves exceeding $$78178 then current structures favor continuation trends targeting resistances approaching$$79500should materialize accordingly.A confirmed breakout past these points especially accompanied by increasing volumes would reinforce existing bullish narratives paving pathways for further upside extensions ahead!Overall underlying trend maintains constructive characteristics—it simply requires proof showcasing enduring energy present within market dynamics presently underway!
Bearish Perspective:
A failure holding onto vital supports below$$77200 exposes Bitcoins vulnerabilities leading back downward rotations potentially testing previous lower levels reaching towards key benchmarks surrounding both75K&73K zones collectively combining fading volumes witnessed across daily charts reflecting persistent rejections encountered repeatedly near significant threshold areas like previously stated resulting scenarios depict markets requiring resets before attempting climbs again higher eventually thereafter making clear gravity hasn’t been negated—it merely awaits opportune moments presenting themselves sooner rather than later !
Frequently Asked Questions (FAQ)
The price of Bitcoin can be influenced by various factors including market demand/supply dynamics,
regulatory news events globally & technological advancements related directly affecting crypto networks!
You can analyze cryptocurrency charts using technical indicators such as RSI,
MACD & moving averages among others which help identify trends & potential reversal points based upon historical data patterns observed historically across different time frames analyzed effectively together combined insights gained therein !