
Bitcoin’s weekly chart is drawing unsettling parallels to one of the most severe sell-offs in its history, and at least one analyst suggests that more turmoil may be on the horizon.
This technical analysis reflects current price movements as a reflection of the macro fractal sequence from 2022, which saw Bitcoin plummet from $69,000 to a cycle low near $15,500. This raises concerns that we might witness a similar downturn in this cycle.
Is History Repeating Itself? The Fractal That Raises Alarm
Crypto analyst philarekt issued a cautionary note on X this week, highlighting what he refers to as “the most perilous macro fractal” currently unfolding within Bitcoin’s pricing structure. His analysis hinges on comparing two weekly Bitcoin charts side by side: one depicting the cycle from 2021 to 2023 and another illustrating the present cycle.
The chart for 2021 shows Bitcoin reaching an apex above $69,000 before forming a three-tap structure—three distinct lower highs arranged within a descending channel—where each bounce was met with rejection prior to an ultimate capitulation leg downward. This resulted in a staggering 34% drop from the last tap down to the absolute bottom of that cycle, catching many investors off guard.
The current chart indicates that after peaking at $126,000 in October 2025, it is mirroring this same pattern almost identically. Both panels for 2022 and projections for 2026 demonstrate Bitcoin adhering to an inclined resistance line while gradually declining within a downward channel. Each rebound fails to break through resistance levels leading up to successive lower lows being established.
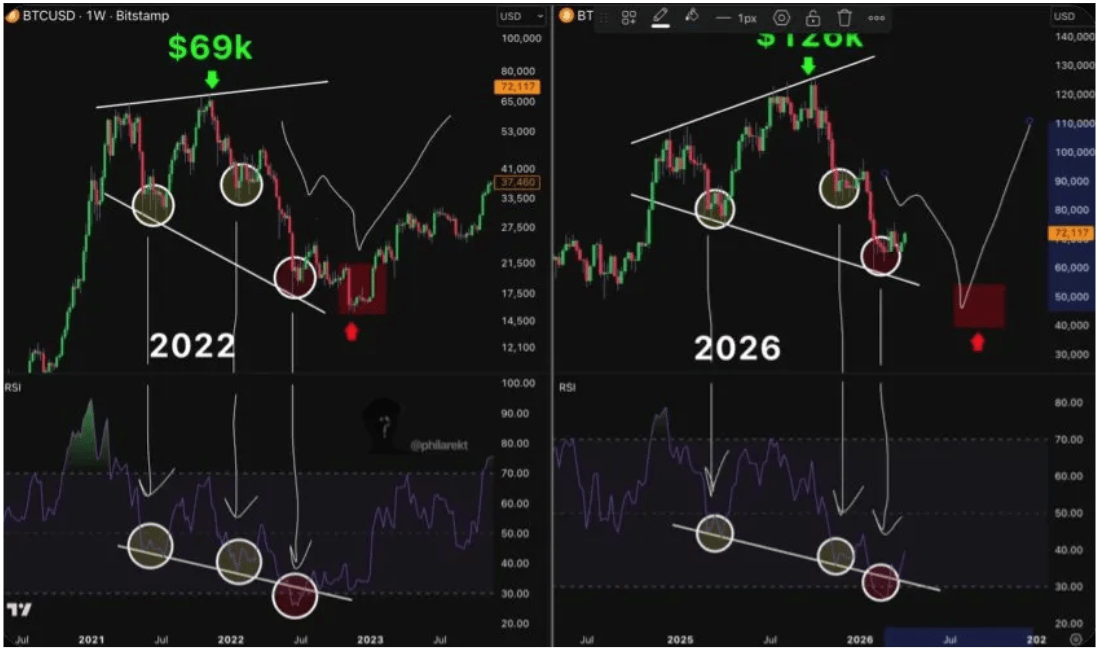
Bitcoin Price Chart. Source: @philarekt On X
If The Fractal Completes Its Cycle?
The weekly RSI (Relative Strength Index), which measures momentum trends, is following patterns akin to those seen in 2022. Additionally, there has been evidence of a moving average death cross on Bitcoin’s price chart; specifically where short-term averages have dipped below long-term averages.
This death cross emerged earlier in March when the Simple Moving Average (SMA) over fifty periods crossed beneath that over two hundred periods (SMA). A similar SMA crossover occurred back in 2022 after Bitcoin had already experienced a decline of about fifty-eight percent from its peak; subsequently falling another forty-six percent before hitting rock bottom.
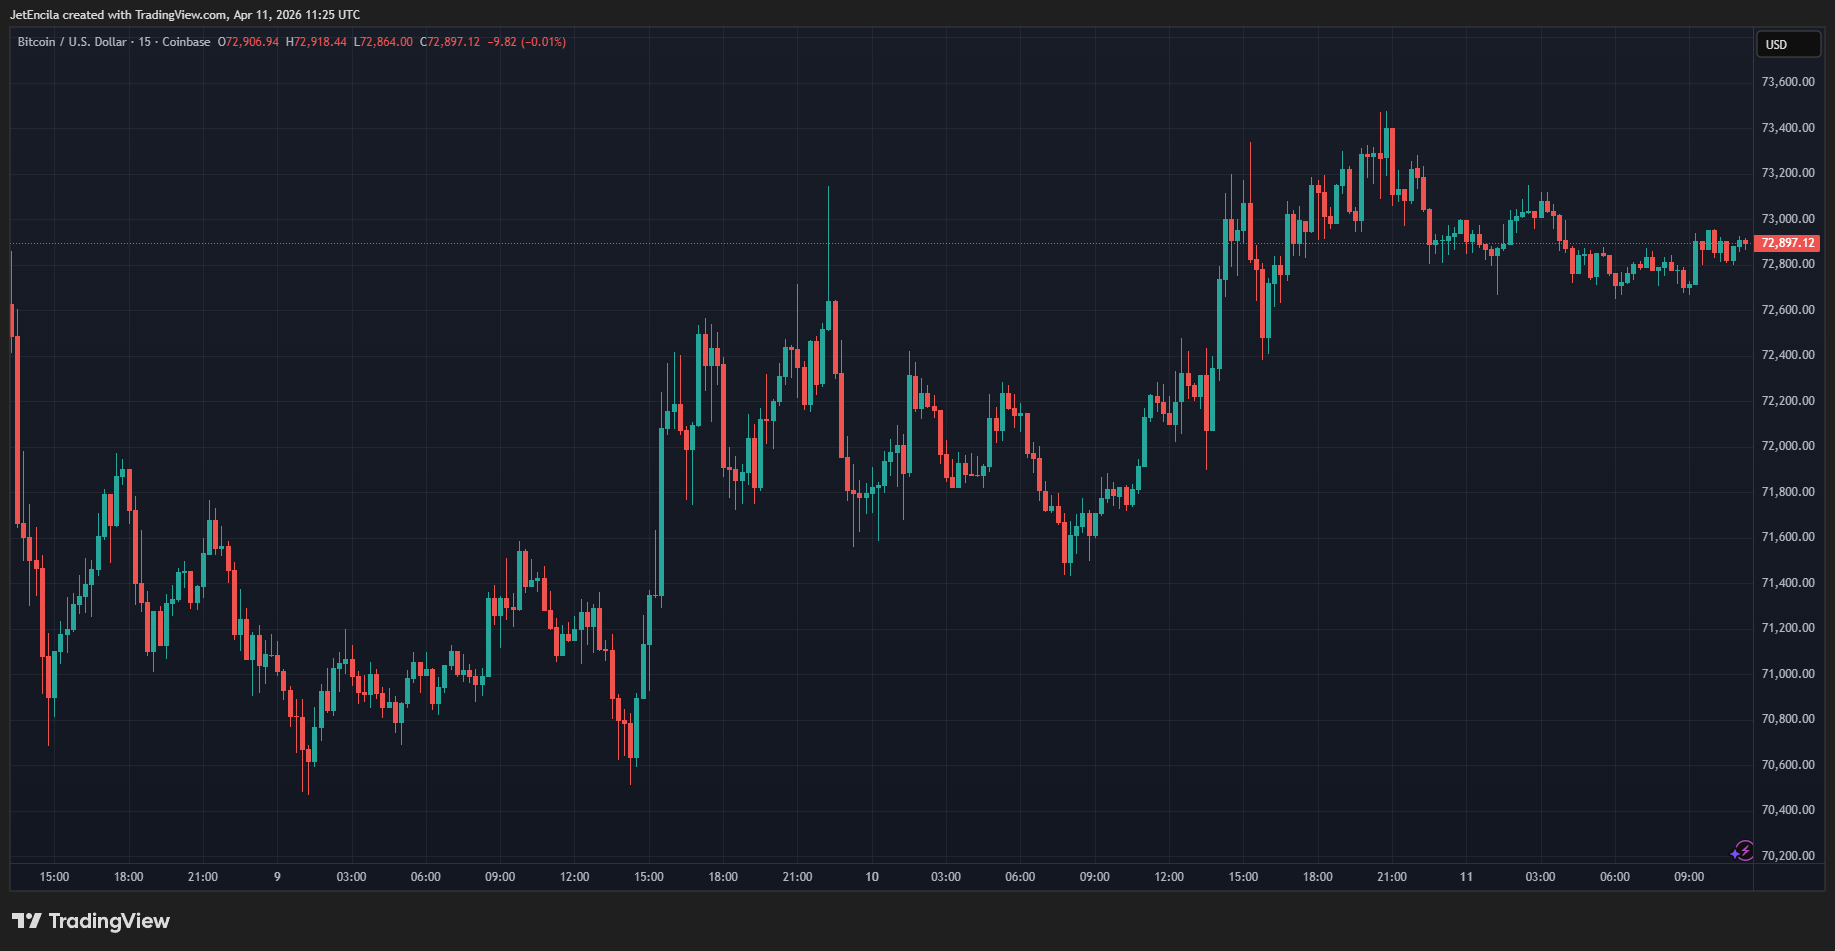
If this pattern continues as suggested by previous cycles’ behavior, we could see Bitcoin undergo one final capitulation move landing between $40K and $50K range. As things stand now however—Bitcoin trades around $72K with an increase of approximately 1.7% over twenty-four hours—a projected drop derived directly from past templates would place prices squarely into that anticipated range based upon historical data indicating potential declines averaging thirty-four percent relative current values observed today.
Nonetheless there remains some optimism beyond such bearish scenarios; since while these fractals indicate possible breakdowns they also suggest subsequent recovery phases post-capitulation events like those witnessed during transitions into accumulation stages paving way towards future bullish cycles ahead!
Featured image sourced via Pexels; chart data courtesy TradingView