
The leading cryptocurrency, Bitcoin ($BTC), has pulled back from its weekly peak of $82,833 amidst growing uncertainties related to the ongoing conflict in the Middle East. This retreat gained traction as $BTC futures recorded their 67th consecutive day of negative funding rates—an indication that sellers are confident in a prolonged price correction. However, historical trends suggest that this scenario may pave the way for a market recovery. Below are crucial price levels to monitor for Bitcoin in May 2026.
Reasons Behind Bitcoin’s Retreat from $83,000
As of Saturday, Bitcoin’s price increased by 0.18%, trading at $80,344. This slight rise comes amid escalating geopolitical tensions following U.S. airstrikes on Iranian military sites after attacks on American naval destroyers in the Strait of Hormuz.
In an ABC interview, President Donald Trump referred to these strikes as a “Love tap,” while asserting that the ceasefire with Iran remains intact but warned that more aggressive actions could follow if Tehran does not comply with negotiations. This development caused significant volatility in oil prices; Brent Crude surged by 2.9% to around $103 per barrel.
This situation led to a swift pullback across the broader crypto market, dragging $BTC down towards the $80,000 mark.
The Importance of Funding Rates Now
Perpetual futures contracts do not have an expiration date and track Bitcoin’s spot price through a periodic payment mechanism known as funding rates designed to keep perpetual market prices aligned with actual values. When bullish sentiment prevails and long positions dominate trading activity, long holders compensate short sellers through these payments; conversely, when bearish sentiment rises and short positions increase significantly—the shorts pay out longs instead.
A negative funding rate indicates market imbalance favoring those betting against it; short sellers incur continuous costs while maintaining their positions during such periods.
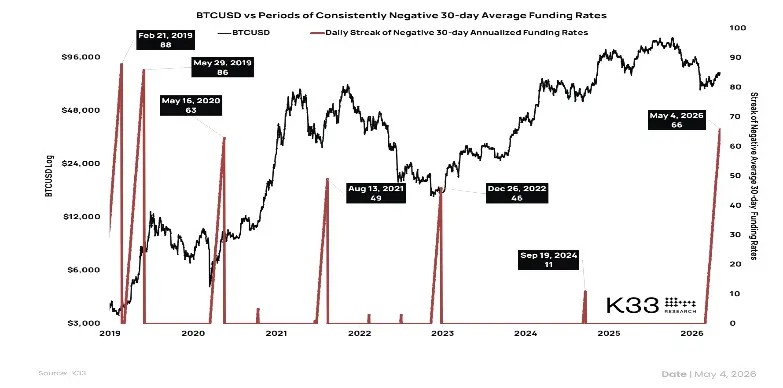
K33 Research reports that Bitcoin futures have experienced negative funding rates for an unprecedented stretch of 67 days—marking its longest streak within ten years—a sign indicating strong commitment among short sellers willing to pay premiums even amid potential recovery momentum for Bitcoin.
“I focus on this regime primarily due to timing,” said Vetle Lunde from K33 Research. “Prolonged negative funding rates historically signal opportune moments for buyers.”
Past Trends Indicate Potential Recovery Following Extended Negative Funding Rates
An analysis comparing K33’s data with insights from blockchain analytics firms like Glassnode and CoinGlass reveals consistent patterns following lengthy periods marked by negative funding rates:
- The COVID Crash Bottom (March 2020): The global markets froze as Bitcoin plummeted below control levels down to $3,800 amidst panic selling; however traders began speculating further declines leading up towards sharply negative funding before witnessing substantial recovery culminating above $60K within one year later.
- (June – August 2021) China Mining Ban:A sudden ban imposed by Beijing triggered fears over future prospects resulting into BTC dropping back near$30K accompanied by49-day period wherefunding turnednegative before recovering toward new all-time highs later within same year.
- (November – December ’22) FTX Collapse:This major exchange failure sent shockwaves throughout crypto space causing open interest surge amongst shorts alongwith simultaneous drop reaching$15K only see it rally past$23k once shorts capitulated end January ’23.
- (2023) Silicon Valley Bank Crisis:A brief decline occurred alongside banking turmoil bringing BTC under$20k mark briefly coincidingwithnegativefundingyet soon recovered thereafter proving resilient once again.
The recurring theme across all instances is clear: prolonged accumulation among short-sellers tends ultimately leads them astray —and when they start covering losses results into amplified rallies ahead!
Beneath The Surface Lies A Short-Squeeze Waiting To Unfold!
The current landscape remains highly volatile particularly due structural aspects surrounding open interest dynamics whereby major exchanges observe increasing figures yet simultaneously persistently exhibit negatives reflecting fresh new trades being made without unwinding existing ones creating classic “loaded spring” setup ripefor triggering potential squeezes whenever catalysts emerge!
This week Alex Kuptsikevich chief analyst at FxPro highlighted how despite failing breach200-day moving average after surging up towards82 .8K signifies lackof buyer exhaustion suggesting threshold level around83 .200 might induce forced cover scenarios pushing upward trajectory potentially reaching93 k!
K33 also observed muted activity occurring regarding Chicago Mercantile Exchange(CME)even though cryptocurrencies regained footing indicating overall institutional positioning still far removedfrom previous highs establishedin2014-2015periods participation slowly resumes albeit cautiously..
Crossover Point For Price As Channel Breakout Faces Possible Setbacks?
This past week witnessed notable rally propelling bitcoinprice upward ranging between74 ,912-82 ,833 establishing breakout trendline resistance pattern observed daily charts accordingly!
Sustained breakout initially expected fuel bullish momentum further yet geopolitical tensions escalated pushed BTC backwithin channel range trading around80 ,388 prompting retest phase aiming reattempt breakouts bolstering position continued recoveries ahead!
If successful post-breakout rallies challenge immediate resistances seen approaching84 ,330 followed closely thereafter leaping onto98 k territory !

USDT -1 d Chart
Conversely should seller pressure persist defending channel resistance positionedaround81 ,300 threshold renewed selling pressures likely ensue pushing retests toward73 ,500 support levels ahead !
### FAQ
**Q1: What factors contributed to recent fluctuations in Bitcoin’s price?**
A1: Recent fluctuations can be attributed primarily due geopolitical tensions including U.S.-Iran conflicts affecting investor sentiment along with persistent trends surrounding futures contracts’ negative funding ratios.
**Q2: How do perpetual futures contracts work?**
A2: Perpetual futures contracts allow traders exposure without expiry dates tracking underlying asset prices utilizing mechanisms like periodic payments termed ‘funding’ ensuring alignment between markets.
**Q3: Why are extended periods of negative funding significant?**
A3: Extended durations indicate prevailing bearish sentiments often lead ultimately result corrections where previously accumulated shorts begin covering thereby triggering substantial upward movements.