The cryptocurrency landscape is undergoing a notable transformation. Following a phase marked by intense fluctuations, Bitcoin’s value has settled back to approximately $65,000. This retreat signifies an important pause for the leading digital currency as market participants evaluate recent macroeconomic developments and institutional behaviors. Experts refer to this phase as a classic example of consolidation.
Does Bitcoin Maintain Its Bullish Momentum?
While the overall trend remains positive, the immediate outlook has shifted towards neutral or slightly bearish territory. The dip to $65,000 has caused some unease among retail traders; however, technical analysis indicates that this correction is healthy and necessary. It helps eliminate overly leveraged positions before any potential rally toward previous peak levels.
Examining Today’s Bitcoin Price: The Importance of the $65K Level
Recent movements on the BTC-USD chart highlight that $65,000 serves as both a psychological anchor and a key technical support zone.
What Factors Led to Bitcoin’s Decline?
A combination of elements contributed to this pullback:
Institutional Profit Taking: After strong gains early in 2026, many institutional investors are securing profits.
Macro-Economic Uncertainty: New tariff policies and changing expectations around Federal Reserve actions have driven investors toward safer assets like gold.
Larger Holder Activity: Data from blockchain analytics platforms such as Glassnode reveal increased inflows into exchanges from major holders—indicating temporary selling pressure.
An Analysis of Bitcoin’s Price Action: Consolidation or Breakdown?
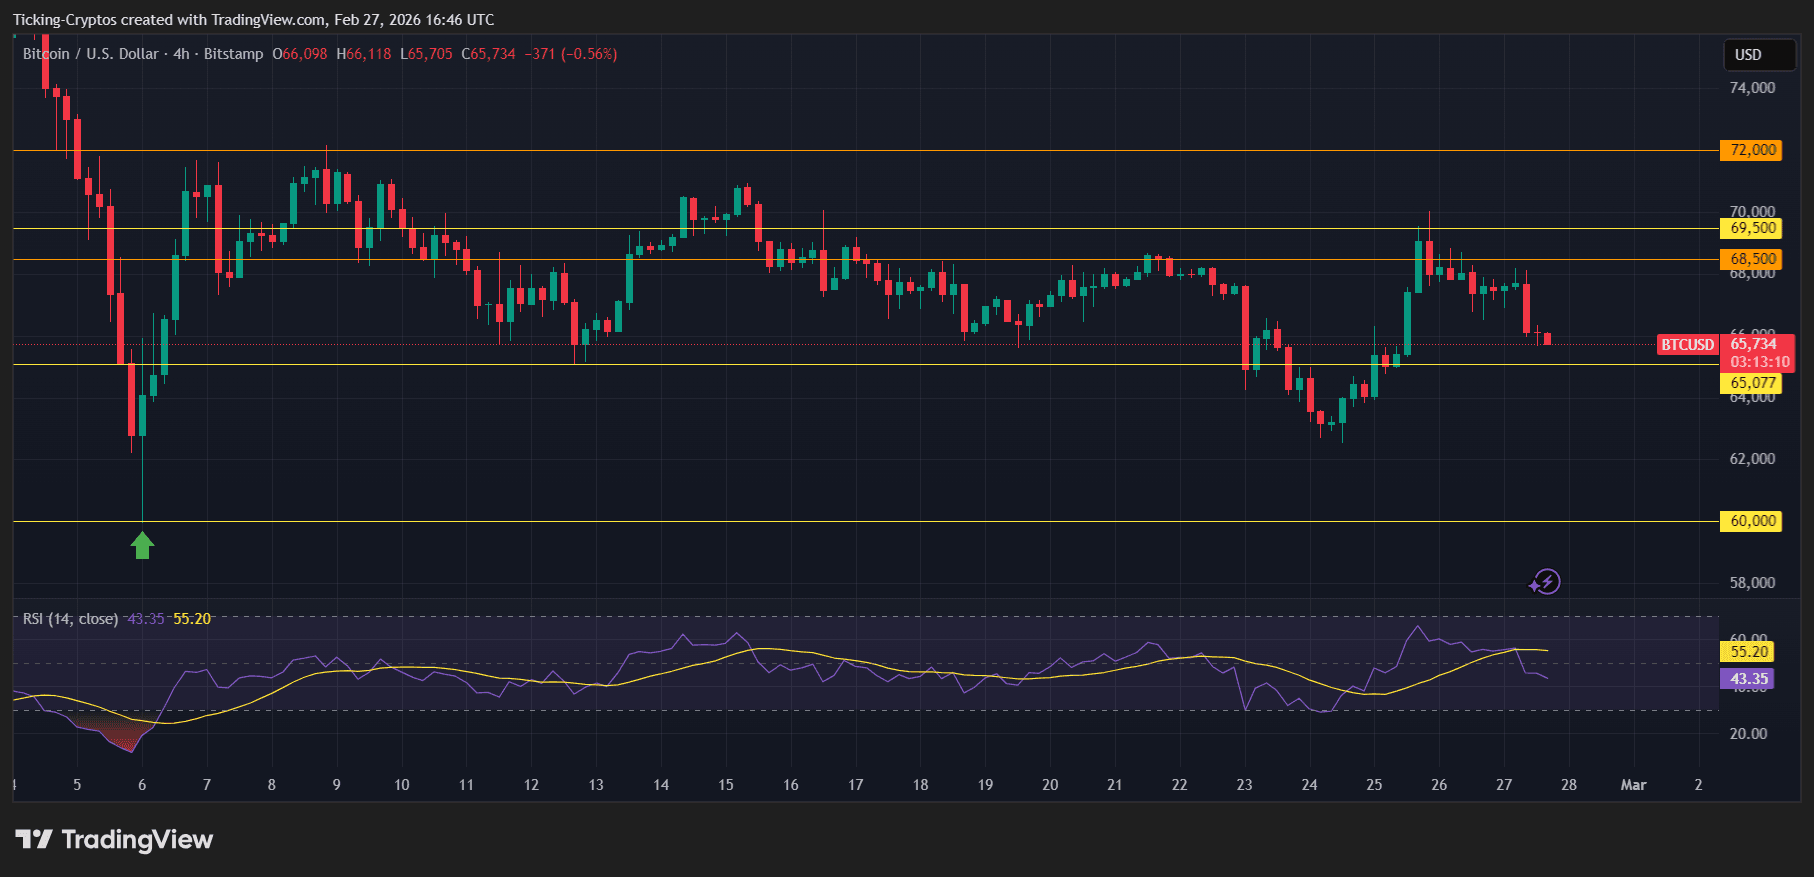
A review of recent four-hour and daily charts reveals that Bitcoin is trading within a descending channel pattern. After reaching highs near $70,000 recently, it has retreated into its current range.
Main Technical Signals Include:
- RSI (Relative Strength Index): Currently around 45 — indicating neither overbought nor oversold conditions—supporting sideways price movement interpretation.
- Certain Support & Resistance Levels:
- – Immediate Support at $65,000 (psychological level)
- – Strategic Support near $62,000 (100-week moving average)
- – Short-term Resistance at approximately $68,500 (20-day EMA)
Volume Trends: Trading volumes have steadied consistent with consolidation phases. A significant volume surge would be needed for confirmation if prices break out either upward or downward from these levels.
The Outlook for Bitcoin Pricing: What Lies Ahead?
The next directional move depends heavily on liquidity dynamics and market sentiment indicators. Presently, The Fear & Greed Index sits deep in “Extreme Fear,” which contrarian traders often interpret as signaling an approaching bottom formation phase.
Bullish Scenario
If BTC sustains above roughly $64,200 while surpassing resistance near $68,000, targets could extend toward $71,500 and potentially challenge psychological ceilings around $75,000.
Bearish Scenario
A firm daily close below about $62,000 raises red flags. This might initiate cascading liquidations pushing prices down toward support zones near $58,000, a historically significant floor observed in late 2024. </p>