The response of Bitcoin’s market to the ongoing conflict in Iran is starting to mirror the price movements observed during the initial month following Russia’s invasion of Ukraine in 2022.
A side-by-side analysis of these two events reveals a remarkably similar pattern: an initial wave of panic selling, followed by a swift recovery, and then a period of volatile consolidation as markets adapt to geopolitical uncertainties.
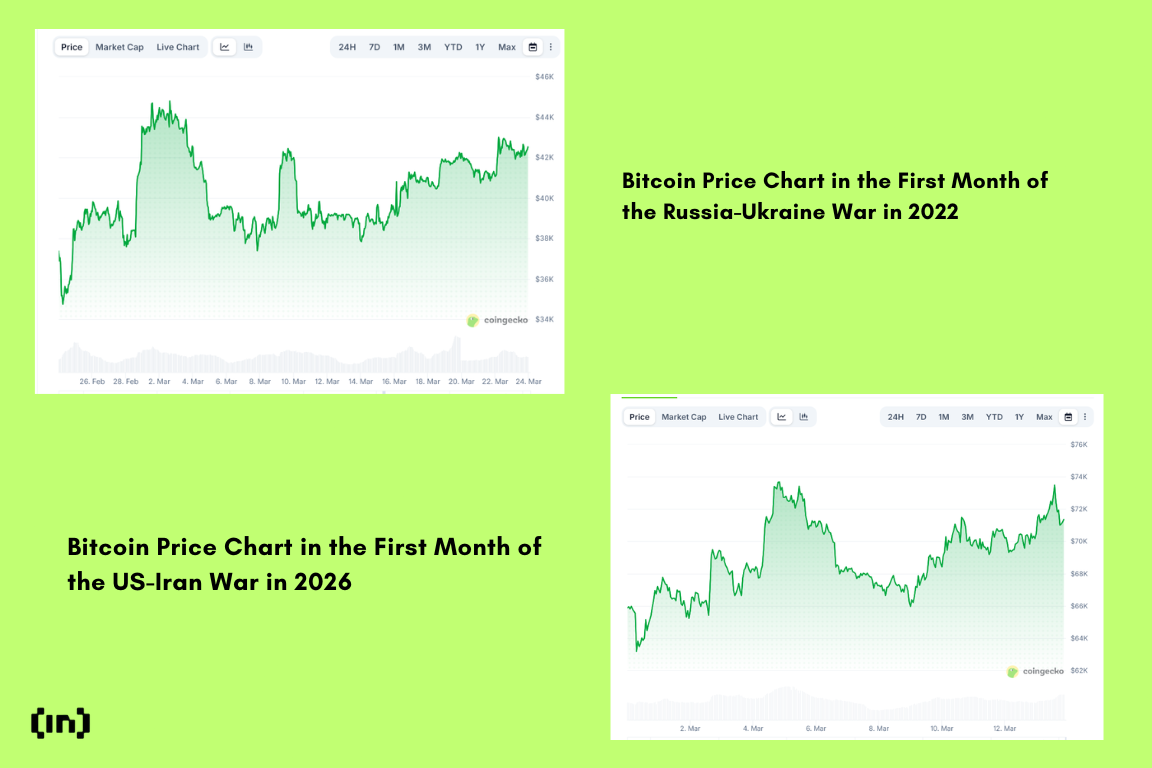
Comparative Analysis of Bitcoin Prices During Early Stages of Ukraine Conflict and Current Iran Situation
Initial Turmoil Followed by Quick Rebound
When Russia launched its invasion on February 24, 2022, Bitcoin experienced an immediate decline as global markets reacted to this unexpected escalation.
However, within just a few days, the cryptocurrency made a notable recovery as traders began reassessing potential economic repercussions.
A similar trend has emerged following U.S. and Israeli military actions against Iran that commenced around February 28, 2026.
Initially reacting with a dip in value upon hearing the news, Bitcoin quickly rebounded towards the $70,000–$73,000 range in subsequent weeks.
This suggests that both instances saw markets rapidly incorporating geopolitical shocks before reaching stabilization.
RSI Indicates Comparable Momentum Fluctuations
The momentum indicators present an analogous narrative.
During the early phase of the Ukraine war, Bitcoin’s Relative Strength Index (RSI) plummeted into oversold levels before bouncing back into robust momentum territory.
The current RSI trend amid the Iranian conflict reflects this behavior closely. Initially declining due to market reactions to warfare news before regaining strength indicates renewed buying interest among traders after initial panic selling—a common occurrence during geopolitical crises.
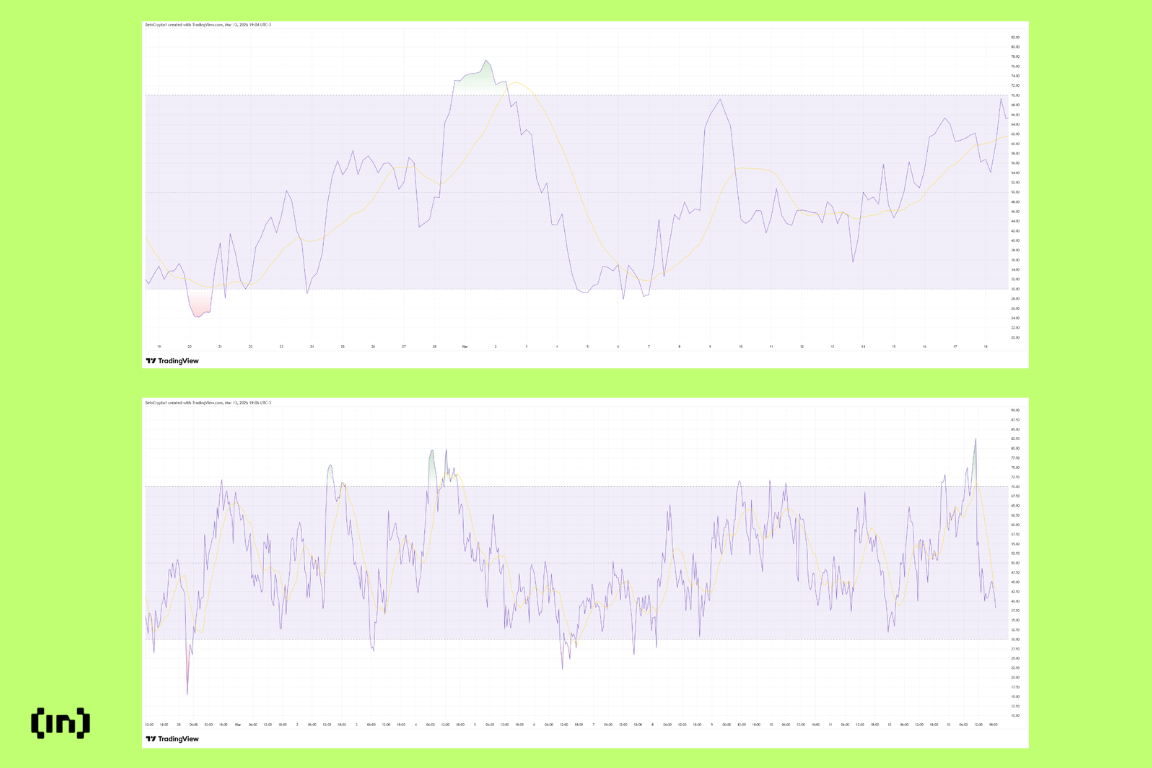
Bitcoin RSI Chart from February through March for Both Years. Source: TradingView
Capital Flow Signals Indicate Ongoing Investment Shifts
The indicators related to capital flow further support this comparison between periods.
Diving into early data from Ukraine’s conflict shows that Chaikin Money Flow (CMF) gradually improved post-initial sell-off—indicating fresh buying pressure entering at lower prices.
This time around during conflicts involving Iran shows CMF exhibiting similar trends with repeated movements toward positive zones—suggesting investors are still rotating capital into Bitcoin when prices dip.
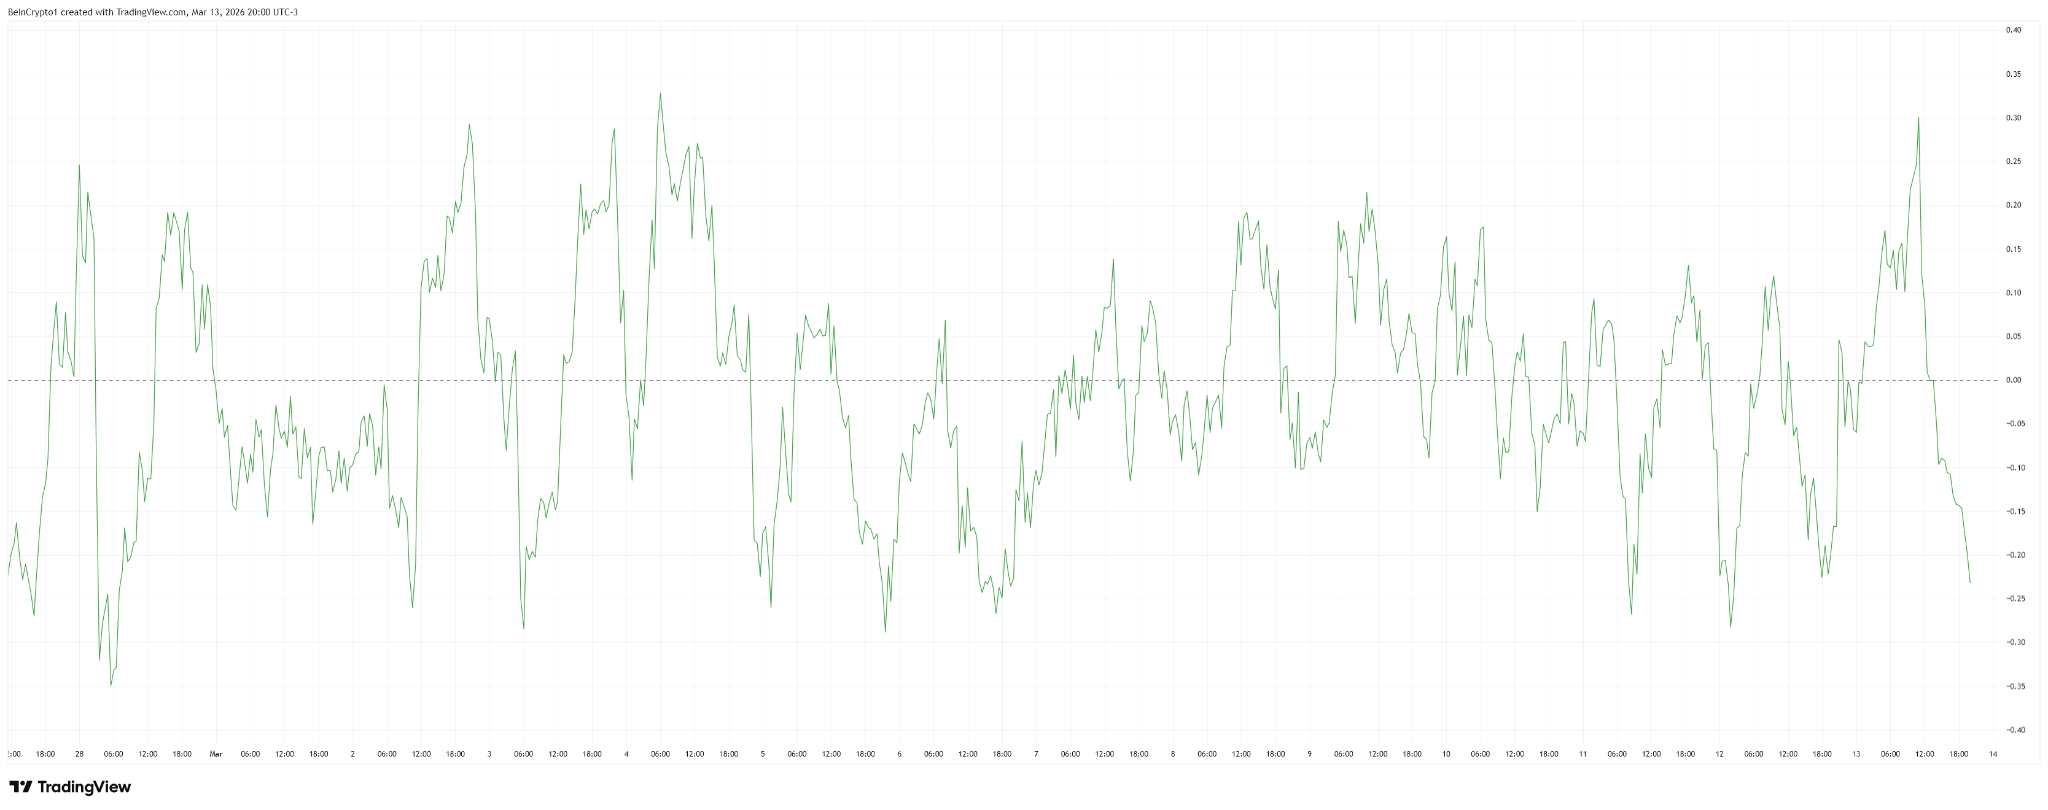
Bitcoin Money Flow Shows Increased Volatility Compared To Initial Month Of The Russia-Ukraine War
Markets Seem To Be Adjusting To Geopolitical Risks
Taken collectively; these insights indicate that Bitcoin’s reaction towards recent Iranian hostilities aligns with previously established patterns.
Instead of inciting prolonged declines; so far; this geopolitical upheaval has resulted primarily in cycles characterized by panic selling followed swiftly by recoveries alongside range-bound volatility.
If trends continue mirroring those seen at earlier stages within Ukrainian warfare dynamics; it seems likely for Bitcoins trading trajectory remains sideways but inclined upwards rather than facing collapse.
Such developments would imply continued short-term volatility yet potential gradual increases driven largely through trader activity focusing on purchasing dips while factoring ongoing risks associated with war pricing strategies.